
This article is about the latest consumer product from the Google stable, something which will revolutionise your eating experience by combining a chicken-broth base with a nanotechnology garnish and a soupçon of deep learning techniques to create a warming meal that also provides a gastro-intestinal health-check. Wait…
…I may have got my wires crossed a bit there. No, I mis-spoke, the article is actually about ever increasing number of CxO titles [1], which has made a roster of many organisations’ executives come to resemble a set of Scrabble tiles.
Specifically I will focus on two values of x, A and D, so the CAO and CDO roles [2]. What do these TLAs [3] stand for, what do people holding these positions do and can we actually prove that, for these purposes only, “A” ≡ “D”?
Breaking the Code

The starting position is not auspicious. What might CAO stand for? Existing roles that come to mind include: Chief Accounting Officer and Chief Administrative Officer. However, in our context, it actually stands for Chief Analytics Officer. There is no ISO definition of Analytics, as I note in one of my recent seminar decks [4] (quoting the Gartner IT Glossary, but with my underlining):
Analytics has emerged as a catch-all term for a variety of different business intelligence and application-related initiatives. In particular, BI vendors use the ‘analytics’ moniker to differentiate their products from the competition. Increasingly, ‘analytics’ is used to describe statistical and mathematical data analysis that clusters, segments, scores and predicts what scenarios are most likely to happen.
I should of course mention here that my current role incorporates the word “Analytics” [5], so I may be making a point against myself. But before I start channeling my 2009 article, Business Analytics vs Business Intelligence [6], I’ll perhaps instead move on to the second acronym. How to decode CDO? Well an equally recent translation would be Chief Digital Officer, but you also come across Chief Development Officer and sometimes even Chief Diversity Officer. Our meaning will however be Chief Data Officer. You can read about what I think a CDO does here.
A observation that is perhaps obvious to make at this juncture is that when the acronym of a role is not easy to pin down, the content of the role may be equally amorphous. It is probably fair to say that this is true of both CAO and CDO job descriptions. Both are emerging roles in the majority of organisations.
Before the Flood
")
One thing that both roles have in common is that – in antediluvian days – their work used to be the province of another CxO, the CIO. This was before many CIOs became people who focus on solution architecture, manage relationships with outsourcers and have their time consumed by running Service Desks and heading off infrastructure issues [7]. Where organisations may have had just a CIO, they may well now have a CIO, a CAO and a CDO (and also a CTO perhaps which splits one original “C” role into four).
Aside from being a job creation scheme, the reasons for such splits are well-documented. The prevalence of outsourcing (and the complexity of managing such arrangements); the pervasiveness and criticality of technology leading to many CIOs focussing more on the care and feeding of systems than how businesses employ them; the relentless rise of Change organisations; and (frequently related to the last point) the increase in size of IT departments (particularly if staff in external partner organisations are included). All of these have pushed CIOs into more business as usual / back-room / engineering roles, leaving a vacuum in the nexus between business, technology and transformation. The fact that data processing is very different to data collation and synthesis has been another factor in CAOs and / or CDOs filling this vacuum.
Some other Points of View
 |
 |
 |
As trailed in some previous articles [8], I have been thinking about the potential CAO / CDO dichotomy for some time. Towards the beginning of this period I read some notes that decision management luminary James Taylor had published based on the proceedings of the 2015 Chief Analytics Officer Summit. In the first part of these he cites comments made by Robert Morison as follows:
Practically speaking organizations need both roles [CAO and CDO] filled – either by one person or by two working closely together. This is hard because the roles are both new and evolving – role clarity was not the norm creating risk. In particular if both roles exist they must have some distinction such as demand v supply, offense v defense – adding value to data with analytics v managing data quality and consistency. But enterprises need to be ready – in particular when data is being identified as an asset by the CEO and executive team. CDOs tend to be driven by fragmented data environments, regulatory challenges, customer centricity. CAO tends to be driven by a focus on improving decision-making, moving to predictive analytics, focusing existing efforts.
Where CAO and CDO roles are separate, the former tends to work on exploiting data, the latter on data foundations / compliance. These are precisely the two vertical extremities of the spectrum I highlighted in The Chief Data Officer “Sweet Spot”. As Robert points out, in order for both to be successful, the CAO and CDO need to collaborate very closely.
Around the same time, another take on the same general question was offered by Jen Stirrup in her 2015 PASS Diary [9] article, Why are PASS doing Business Analytics at all?. Here Jen cites the Gartner distinctions between descriptive, diagnostic, predictive and prescriptive analytics adding that:
Business Intelligence and Business Analytics are a continuum. Analytics is focused more on a forward motion of the data, and a focus on value.
Channeling Douglas Adams, this model can be rehashed as:
- What happened?
- Why did it happen?
- What is going to happen next?
- What should we be doing?
As well as providing a finer grain distinguishing different types of analytics, the steps necessary to answer these questions also tend to form a bridge between what might be regarded as definitively CDO work and what might be regarded as definitively CAO work. As Jen notes, it’s a continuum. Answering “What happened?” with any accuracy requires solid data foundations and decent data quality, working out “What is going to happen next?” requires each of solid data foundations, decent data quality and a statistical approach.
Much CDO about Nothing

In some organisations, particularly the type where headcount is not a major factor in determining overall results, separate CAO and CDO departments can coexist; assuming of course that their leaders recognise their mutual dependency, park their egos at the door and get on with working together. However, even in such organisations, the question arises of to whom should the CAO and CDO report, a single person, two different people, or should one of them report to the other? In more cost-conscious organisations entirely separate departments may feel like something of a luxury.
My observation is that CAO staff generally end up doing data collation and cleansing, while CDO staff often get asked to provide data and carry out data analysis. This blurs what is already a fairly specious distinction between the two areas and provides scope for both duplication of work and – more worryingly – different answers to the same business questions. As I have mentioned in earlier articles, to anyone engaged in the fields, Analytics and Data Management are two sides of the same coin and both benefit from being part of the same unitary management structure.

If we consider the arrangements on the left-hand side of the above diagram, the two departments may end up collaborating, but the structure does not naturally lead to this. Indeed, where the priorities of the people that the CAO and CDO report in to differ, then there is scope for separate agendas, unhealthy competition and – again – duplication and waste. It is my assertion that the arrangements on the right-hand side are more likely to lead to a cohesive treatment of the spectrum of data matters and thus superior business outcomes.
In the right-hand exhibit, I have intentionally steered away from CAO and CDO titles. I recognise that there are different disciplines within the data world, but would expect virtual teams to form, disband and reform as required drawing on a variety of skills and experience. I have also indicated that the whole area should report into a single person, here given the monicker of TDJ (or Top Data Job [10]). You could of course map Analytics Lead to CAO and Data Management lead to CDO if you chose. Equally you could map one or other of these to the TDJ, with the other subservient. To an extent it doesn’t really matter. What I do think matters is that the TDJ goes to someone who understands the whole data arena; both the CAO and CDO perspectives. In my opinion this rules out most CEOs, COOs and CFOs from this role.
More or less Mandatory Sporting Analogy [11]

An analogy here comes from Robert Morison’s mention of “offense v defense” [12]. This puts me in mind of an [Association] Football Manager. In Soccer (to avoid further confusion), there are not separate offensive and defensive teams, whose presence on the field of play are mutually exclusive. Instead your defenders and attackers are different roles within one team; also sometimes defenders have to attack and attackers have to defend. The arrangements in the left-hand organogram are as if the defenders in a Soccer team were managed by one person, the attackers by another and yet they were all expected to play well together. Of course there are specialist coaches, but there is one Manager of a Soccer team who has overall accountability for tactics, selection and style of play (they also manage any specialist coaches). It is generally the Manager who lives or dies according to their team’s success. Equally, in the original right-hand organogram, if the TDJ is held by someone who understands just analytics or just data management, then it is like a Soccer Manager who only understands attack, but not defence.
The point I am trying to make is probably more readily apprehended via the following diagram:
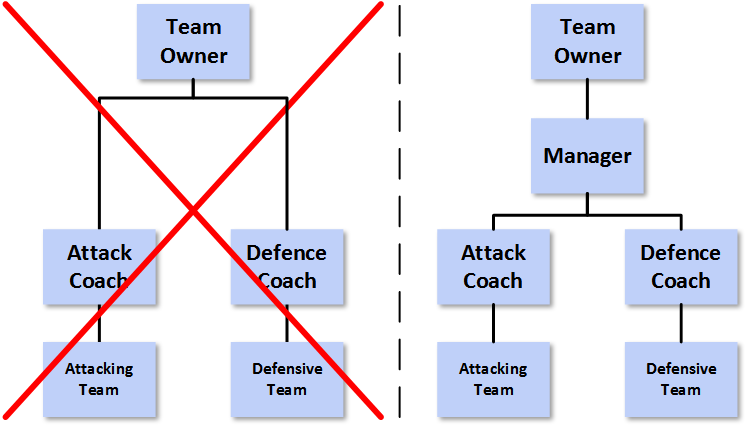
On the assumption that the Manager on the right knows a lot about both attack and defence in Soccer, whereas the team owner is at best an interested amateur, then is the set up on the left or on the right likely to be a more formidable footballing force?
Even in American Football the analogy still holds. There are certainly offensive and defensive coaches, each of whom has “their” team on the park for a period. However, it is the Head Coach who calls the shots and this person needs to understand all of the nuances of the game.
In Closing
So, my recommendation is that – in data matters – you similarly have someone in the Top Data Job, with a broad knowledge of all aspects of data. They can be supported by specialists of course, but again someone needs to be accountable. To my mind, we already have a designation for such as person, a Chief Data Officer. However, to an extent this is semantics. A Chief Analytics Officer who is knowledgeable about Data Governance and Data Management could be the head data honcho [13], but one who only knows about analytics is likely to have their work cut out for them. Equally if CAO and CDO functions are wholly separate and only come together in an organisation under someone who has no background in data matters, then nothing but problems is going to arise.
The Top Data Job – or CDO in my parlance – has to be au fait with the span of data activities in an organisation and accountable for all work pertaining to data. If not then they will be as useful as a Soccer Manager who only knows about one aspect of the game and can only direct a handful of the 11 players on the field. Do organisations want some chance of winning the game, or to tie their hands behind their backs and don a blindfold before engaging in data activities? The choice should not really be a difficult one.
Notes
| [1] |
∀ x : 65 ≤ ascii(x) ≤ 90. |
| [2] |
“C”, “A”, “O” + “C”, “D”, “O” + (for no real reason save expediency) “R” allows you to spell ACCORD, which scores 11 in Executive Scrabble. |
| [3] |
Three Letter Acronyms. |
| [4] |
Data Management, Analytics, People: An Eternal Golden Braid – A Metaphorical Fugue On The Data ⇒ Information ⇒ Insight ⇒ Action Journey In The Spirit Of Douglas R. Hofstadter – IRM(UK) Enterprise Data / Business Intelligence 2016 |
| [5] |
I hasten to add that it also contains the phrase “Data Management” – see here. |
| [6] |
Probably not a great idea for any of those involved. |
| [7] |
Whether or not this evolution (or indeed regression) of the CIO role has proved to be a good thing is perhaps best handled in a separate article. |
| [8] |
Including: |
| [9] |
PASS was co-founded by CA Technologies and Microsoft Corporation in 1999 to promote and educate SQL Server users around the world. Since its founding, PASS has expanded globally and diversified its membership to embrace professionals using any Microsoft data technology. |
| [10] |
With acknowledgement to Peter Aiken. |
| [11] |
A list of my articles that employ sporting analogies appears – appropriately enough – at the beginning of Analogies. |
| [12] |
That’s “offence vs defence” in case any readers were struggling. |
| [13] |
Maybe organisations should consider adding HDH to their already very crowded Executive alphabet soup. |


