The Data and Analytics Dictionary

The Data and Analytics Dictionary

This free dictionary covers terms commonly used in the Data and analytics field. It is not intended to be exhaustive. Instead I have focussed on a few terms I feel to be pertinent, perhaps particularly to those with less of a background in the area. I have avoided covering the second-level terms that are related to most of the definitions below (so I reference Cassandra, Flink, Hadoop, Hive, Pig and Spark, but none of Flume, HBase, Impala, Kafka, Oozie, Phoenix, Sqoop, Storm or ZooKeeper), instead trying to focus on the big picture. Similarly, I have not included basic statistical terms such as Standard Deviation or p-value, mostly to avoid the dictionary becoming too large.

All entries in the Data and Analytics Dictionary may now be linked to directly by external sites. These items have an address box appearing after them, together with a Click to copy link to Dictionary entry to clipboard icon. Clicking on the icon will copy the entry’s link to your clipboard, or you can just copy the link directly from its box.

If you would like to contribute a definition for inclusion in the Dictionary, you can do using the dedicated form. Submissions will be subject to editorial review and are not guaranteed to be accepted. If you have found The Data & Analytics Dictionary useful or informative, then please consider supporting its maintenance and expansion by contributing to the costs of its upkeep here.

– Index –
| Submit your own definition | Consider supporting us |
A B C D E F G
H I J K L M N
O P Q R S T U
V W X Y Z
– A – Return to Index
| Submit your own definition | Consider supporting us |
AI

See: Artificial Intelligence.

Algorithm

A set of instructions (frequently Mathematical in nature), written down as a series of steps, which are generally iterated through many times in order to achieve some task or find some result. Computers are good at running algorithms.

Analysis

Analysis is a word used in many contexts. Formally it means the breaking down of something (normally something complex) into smaller and simpler constituent parts, each of which may be studied more easily, allowing insight (small ‘i’) to the more complex whole to be obtained. The word itself comes from the Greek, ἀνάλυσις (análusis, “a breaking up”, from ana- “up, throughout” and lusis “a loosening”).

In Mathematics, Analysis is the study of processes with an infinite number of steps, for example limits, infinite series, differentiation, integration and analytic functions. Breaking something down into an infinite number of parts is of course taking Analysis to extremes!

In a business context, Analysis can be coupled with other words such as “Financial” and “Marketing” to cover processes of investigating facts and figures in these areas. It is also used in the names of many Statistical activities such as Multivariate Analysis, Sensitivity Analysis, Time Series Analysis and several others.

Data Analysis is a more general term for sifting through Data to uncover meaning and can be applied to a range of activities such as Data Modelling, Data Mining, Data Science and so on, but is perhaps nowadays most frequently used to mean Analysis of Data that does not employ advanced Statistical or Modelling techniques, but rather more traditional “number crunching”.

The word is also often used to cover activities leading up to the Analysis of Data, such as those covered by the catch-all term Data Wrangling.

Analysis Facility

Analysis Facility is a high-level term used to describe a packaged up combination of tools and Data necessary to carry out specific sets of Analyses. Such a facility might include a selection of the following: analysis tools such as OLAP Cubes, Data Visualisation capabilities and maybe just linked Excel spreadsheets; Query / data extraction tools (like SQL or Pig), programming languages / environments (like R or Python) and the data which they will all access, most likely pre-formatted and consolidated to make working with it easier.

Analytical Repository

A Data Repository which forms a major part of a modern Data Architecture and is focussed on supporting the generation of Insight (cf. an Operational Repository, which is focussed on supporting the generation of Information). An Analytical Repository will hold a wide variety of both internally and externally sourced data, often in raw form, but sometimes also Curated.

The volume of data will typically be much larger than for an Operational Repository and its contents will be subject to fewer Data Controls and be less highly reconciled. Analytical repositories are primarily used by Data Scientists to facilitate the development of Models or as inputs to Machine Learning, but outputs from them may also be surfaced in Dashboards and help to support Digital applications. Analytical Repositories are more likely to employ technologies in the Big Data suite (effectively resembling Data Lakes) than their Operational counterparts, but many will be SQL-based, particularly where this is more the core competency of the organisation.

See also: A Simple Data Capability Framework

Analytics

Deriving Insights from Data which are generally beyond the purpose for which the Data was originally captured – to be contrasted with Information which relates to the meaning inherent in Data (i.e. the reason that it was captured in the first place). Analytics often employ advanced statistical techniques (logistic regression, multivariate regression, time series analysis etc.) to derive meaning from Data.

Gartner refer to four types of Analytics: descriptive, diagnostic, predictive and prescriptive analytics. In an article I referred to these as:

  1. What happened?
  2. Why did it happen?
  3. What is going to happen next?
  4. What should we be doing?

An Analytics department, together with a Data Management department, may be part of a broader Data function, which would sometimes reporting to a CDO. Alternatively, it may be more independent and perhaps be headed by a Chief Analytics Officer (CAO).

See also: The Anatomy of a Data Function – Part I and An in-depth Interview with Allan Engelhardt about Analytics

Anomaly Detection (Outlier Detection)

Techniques, used in Data Mining and elsewhere, for identifying points in a set of Data that do not conform to the general characteristics of the rest of the Data. A classic example would be detecting fraudulent transactions amongst the overwhelmingly larger number of legitimate transactions processed by a bank or credit card company. More seriously it could be identifying which of a number of photographs of chronic skin lesions could instead be a malignant tumour. Equally the objective could be to discard anomalous Data that is otherwise skewing a population (e.g. the one multi-billionaire in a sample of 5,000 people).

Anonymisation

Anonymisation is one approach to ensuring the Protection of Personal Data. The term drives from “anonym”, which means “no name” in Greek.

An Operational System will need to have things like customer name, address and contact details stored in it (though obviously in a secure manner) in order to do things like despatching goods accurately, or handling complaints. Such usage has a legal basis under GDPR and is typically consented to by the customer.

However, an Analytical System would not necessarily be covered by the same legal basis / customer consent. In order for the Analytical System to be able to use the records from the Operational System, the Personal Data must be somehow protected.

Anonymisation is the most simple way to achieve this objective and consists of nulling out fields containing Personal Data (or filling them with some other character, such as a blank space or an X). While probably the most secure approach, it precludes any analysis relating to the Personal Data (e.g. breaking down data by male or female or analysing by geographic area), some of which may be beneficial to the person involved.

See also: Pseudonymisation

Python

A Open Source programming language that is often the tool of choice for Data Scientists manipulating large Data sets. Some reasons for this include its ease of use and its extensive libraries of statistical capabilities.

API

See: Application Programming Interface.

Application Programming Interface (API)

An Application Programming Interface is a way for two pieces of code (whole applications or components) to interact. This will consist of a set of rules that tell the developer of a computer programme how get another piece of code (whose internal logic is not necessarily accessible to the developer, i.e. a “black box”) to do something. The API will tell a user what requests they can make of the code, how to make them and what they can expect in return.

Specific to the Data arena, an API may specify how to retrieve data from an application.

Artificial Intelligence (AI)

A scientific discipline devoted to the in silico creation of cognitive agents which mimic (or exceed) the behaviour of self-aware systems (such as humans). Milestones in AI include beating humans at Chess (IBM Deep Blue 1996), Jeopardy (IBM Watson 2011) and Go (Google AlphaGo 2016). Self-driving cars are another current example of AI in action.

From a business perspective, some disciplines which come under the AI umbrella include: Image Recognition, Machine Learning, Natural Language Processing and (perhaps less obviously) Robotic Process Automation.

See also: AI Platform and Explainable AI.

Artificial Intelligence Platform

A class of software that wraps AI capabilities in a user interface that allows them to be leveraged by people who do not have a PhD in the field. Some such platforms will also support non-AI statistical approaches such as Linear Regression. Others attempt to make what is sometimes a “black box” process more transparent and thus auditable. AI Platforms will also typically have built in Data Visualisation capabilities.

– B – Return to Index
| Submit your own definition | Consider supporting us |
BA

See Business Analyst.

Bar Chart

See Chart.

Bayes’ Theorem (Bayesian Inference / Bayesian Network)

A form of Bayes’ Theorem was proved by the Reverend Thomas Bayes at some point in the late 1750s (he never published his work, which only came to light after his death in 1761). It is a theorem in Probability Theory and relates to the probability of some event, A, occurring, given that some other event, B, has occurred. This is called conditional probability. A statement of Bayes’ Theorem in Mathematical language is:

P(A\mid B)=P(B\mid A)\hspace{1mm}\dfrac{P(A)}{P(B)}

which may be read as:

“The conditional probability of A occurring, given that B has occurred is equal to the product of the conditional probability of B occurring, given that A has occurred with the ratio of the non-conditional probabilities of A and B occurring.”

The importance of this result is that when each of P(A), P(B) and P(B\mid A) are known, then P(A\mid B) may be calculated.

Practically, Bayes’ Theorem offers a way to recursively update a Statistical Model as more data becomes available. This process is called Bayesian Inference. Finally, Bayes’ Theorem also allows for the construction of Bayesian Networks, directed graphs cataloguing variables in a model, together with their conditional probabilities. Amongst other things, Bayesian Networks are used extensively in Machine Learning.

Behavioural Analytics

A discipline focussed on how users interact with mobile applications and web-sites in order to anticipate and meet their future wants and needs. A very basic example is a web grocer reminding you to purchase items that you generally buy, but which are not in your current shopping basket. Slightly more advanced would be an online store suggesting items that you might be interested in, based on those you have both looked at and purchased historically (“if you liked X, you might like Y”; “people who bought W, also bought Z” etc.). Behavioural Analytics can also help to better design web-sites so that people reaching them as a result of searching for a product have this prominently displayed to them.

Big Data

A suite of Open Source technologies (clustered around the Apache Hadoop platform) which leverage multiple commodity servers to spread the load of storing and processing very large Data sets (such as those created by the Internet of Things) and provide a range of tools and software that support advanced statistical analysis. These servers can be on-premises or cloud-based with associated security. Big Data technologies are particularly adept at handling Unstructured Data.

Big Data technologies that are included in the Data and Analytics Dictionary include:

See also: Do any technologies grow up or do they only come of age?

Big Table

Google’s proprietary distributed Database platform, which underpins Gmail, Google Maps, YouTube and many other well-known services. It is the precursor to Big Data technologies and Hadoop in particular.

Binary

Our normal number system, Decimals, is based on powers of 10 (hence 100 = 102, 1,000 = 103) and employs positional notation, i.e. the decimal number 48,037 is equal to: 4 × 10⁴ + 8 × 10³ + 0 × 102 + 3 × 101 + 7 × 100 (noting of course that anything to the power 0 is equal to 1).

Binary is a number system based instead on powers of 2. Here 100 = 22 (or 4 in decimal), 1,000 = 23 (or 8 in decimal) and so on. So the binary number 11,010 means: 1 × 24 + 1 × 23 + 0 × 22 + 1 × 21 + 0 × 20, which equals 16 + 8 + 0 + 2 + 0, or 26 in decimal.

The fact that Binary deals in only 1s and 0s makes it easy to map it to sets of switches that are either on or off (1 is on, 0 is off). Such sets of switches are essentially how Data is stored electronically. It is also easy to add or subtract numbers stored in binary, which is achieved by performing systematic changes to the state of the switches. This is how processing units (like the chips in PCs or ‘phones) carry out computations. This means that the vast majority of Data stored or processed by computers is in Binary.

Business Intelligence

There is no ISO definition, but I use this term as a catch-all to describe the transformation of raw Data into Information that can be disseminated to business people to support decision-making.

See also: The Anatomy of a Data Function – Part I and Keynote Articles Section 1.

Bubble Chart

See Chart.

Boosting [Machine Learning]

See Model.

Bot

See: Robot.

Business Analyst (BA)

Business Analysts are people who focus on gathering requirements for the development of IT systems (or networks of such systems), changes to existing ones, or to guide the implementation of commercially available software. The level of technical ability that a BA possesses can vary immensely and some may have no experience of either design or coding, whereas others may be quite technically proficient. However, it is more important that the BA has a strong background in processes as it is business processes that generally need to be better supported (or introduced) as a result of their work. If a BA also has design skills, this can help to smooth the handover of work to internal IT or third party staff.

BAs can sometimes be a part of an IT organisation, or, if there is a Change Team distinct from IT, part of this department. It is not a hard and fats rule, but IT BAs tend to be more technical (for obvious reasons) and Change BAs less so, often leaving all aspects of physical implementation of changes to others. It is generally good practice for BAs to also be active in the testing phase of introducing new or changed software.

See also: Data Business Analyst.

Business Glossary

Contributor: Tenny Thomas Soman

A list of terms and their definitions which captures the business vocabulary of an organisation and includes an enterprise-wide agreed view of business concepts and business terms. This could be embodied in an application, like Collibra, or – at the other extreme – simply held in an Excel spreadsheet. Typical drivers for a Business Glossary include: enabling effective Data Governance, facilitating Business/IT collaboration and ensuring regulatory alignment.

– C – Return to Index
| Submit your own definition | Consider supporting us |
CAO

See: Chief Analytics Officer.

Cartogram

See Chart.

Cassandra

More properly Apache Cassandra. Cassandra is a distributed file system (like HDFS), but which is targeted more at operational scenarios. As such it supports higher availability than HDFS. Rather than Google, Cassandra was originally a Facebook technology.

CDO

See: Chief Data Officer.

Chart (Graph)

A Chart is a way to organise and Visualise Data with the general objective of making it easier to understand and – in particular – to discern trends. Below is presented – in alphabetic order – a selection of frequently used Chart types:

Note:

Throughout I use the word “category” to refer to something discrete that is plotted on an axis, for example France, Germany, Italy and The UK, or 2016, 2017, 2018 and 2019. I use the word “value” to refer to something more continuous plotted on an axis, such as sales or number of items etc. With a few exceptions, the Charts described below plot values against categories. Both Bubble Charts and Scatter Charts plot values against other values.

I use “series” to mean sets of categories and values. So if the categories are France, Germany, Italy and The UK; and the values are sales; then different series may pertain to sales of different products by country.

Bar & Column Charts

Bar Chart

Bar Charts is the generic term, but this is sometimes reserved for charts where the categories appear on the vertical axis, with Column Charts being those where categories appear on the horizontal axis. In either case, the chart has a series of categories along one axis. Extending rightwards (or upwards) from each category is a rectangle whose width (height) is proportional to the value associated with this category. For example, if the categories related to products, then the size of rectangle appearing against Product A might be proportional to the number sold, or the value of such sales. Sometimes the bars are clustered to allow multiple series to be charted side-by-side, for example yearly sales for 2015 to 2018 might appear against each product category.

See also: a section of As Nice as Pie

Bubble Charts

Bubble Chart

Bubble Charts are used to display three dimensions of data on a two dimensional chart. A circle is placed with its centre at a value on the horizontal and vertical axes according to the first two dimensions of data, but then then the area of the circle reflects the third dimension (research suggests that humans are more attuned to comparing areas of circles than say their diameters). The result is reminiscent of a glass of champagne (then maybe this says more about the author than anything else).

Cartograms

Map

There does not seem to be a generally accepted definition of Cartograms. Some authorities describe them as any diagram using a map to display statistical data; I cover this type of general chart in Maps Charts below. Instead I will define a Cartogram more narrowly as a geographic map where areas of map sections are changed to be proportional to some other value; resulting in a distorted map. So, in a map of Europe, the size of countries might be increased or decreased so that their new areas are proportional to each country’s GDP.

Histograms

Histogram

A type of Bar Chart (typically with categories along the horizontal axis) where the categories are bins (or buckets) and the bars are proportional to the number of items falling into a bin. For example, the bins might be ranges of ages, say 0 to 19, 20 to 39, 30 to 49 and 50+ and the bars appearing against each might be the UK female population falling into each bin.

See also: A Tale of Two [Brexit] Data Visualisations

Line Charts

Line Chart

These typically have categories across the horizontal axis and could be considered as a set of line segments joining up the tops of what would be the rectangles on a Bar Chart. Clearly multiple lines, associated with multiple series, can be plotted simultaneously without the need to cluster rectangles as is required with Bar Charts. Lines can also be used to join up the points on Scatter Charts (below) assuming that these are sufficiently well ordered to support this.

See also: The first exhibit in New Thinking, Old Thinking and a Fairytale

Map Charts

Cartogram

These place data on top of geographic maps. If we consider the canonical example of a map of the US divided into states, then the degree of shading of each state could be proportional to some state-related data (e.g. average income quartile of residents). Or more simply, figures could appear against each state. Bubbles (see above) could be placed at the location of major cities (or maybe a bubble per country or state etc.) with their size relating to some aspect of the locale (e.g. population). An example of this approach might be a map of US states with their relative populations denoted by Bubble area. Also data could be overlaid on a map, for example coloured bands showing different intensities of rainfall in different areas.

See also: Hurricanes and Data Visualisation: Part I – Rainbow’s Gravity

Pie Charts

Pie Chart

These circular charts normally display a single series of categories with values, showing the proportion each category value is of the total. For example a series might be the nations that make up the United Kingdom and their populations: England 55.62 million people, Scotland 5.43 million, Wales 3.13 million and Northern Ireland 1.87 million. The whole circle represents the total of all the category values (e.g. the UK population of 66.05 million people). The ratio of a segment’s angle to 360° (i.e. the whole circle) is equal to the percentage of the total represented by the linked category’s value (e.g. Scotland is 8.2% of the UK population and so will have a segment with an angle of just under 30°). Sometimes the segments are “exploded” away from each other.

See also: As Nice as Pie

Radar [Spider] Charts

Radar Chart

Radar Charts are used to plot one or more series of categories with values that fall into the same range. If there are six categories, then each has its own axis called a radius and the six of these radiate at equal angles from a central point. The calibration of each radial axis is the same. For example Radar Charts are often used to show ratings (say from 5 = Excellent to 1 = Poor) so each radius will have five points on it, typically with low ratings at the centre and high ones at the periphery. Lines join the values plotted on each adjacent radius, forming a jagged loop. Where more than one series is plotted, the relative scores can be easily compared. A sense of aggregate ratings can also be garnered by seeing how much of the plot of one series lies inside or outside of another.

Scatter Charts

Scatter Chart

In most of the cases we have dealt with to date, one axis has contained discrete categories and the other continuous values (though our rating example for the Radar Chart had discrete categories and values). For a Scatter Chart both axes plot values, either continuous or discrete. A series would consist of a set of pairs of values, one to plotted on the horizontal axis and one to be plotted on the vertical axis. For example a series might be a number of pairs of midday temperature (to be plotted on the horizontal axis) and sales of ice cream (to be plotted on the vertical axis). As may be deduced from the example, often the intention is to establish a link between the pairs of values – do ice cream sales increase with temperature? This aspect can be highlighted by drawing a line of best fit on the chart; one that minimises the total distance between each plotted point and the line. Further series, say sales of coffee versus midday temperature can be added.

See also: Linear Regression

Tree Maps

Tree Map

Tree Maps require a little bit of explanation. The best way to understand them is to start with something more familiar, a hierarchy diagram with three levels (i.e. something like an organisation chart). Consider a café that sells beverages, so we have a top level box labelled Beverages. The Beverages box splits into Hot Beverages and Cold Beverages at level 2. At level 3, Hot Beverages splits into Tea, Coffee, Herbal Tea and Hot Chocolate; Cold Beverages splits into Still Water, Sparkling Water, Juices and Soda. So there is one box at level 1, two at level 2 and nine at level 3. Next let’s also label each of the boxes with the value of sales in the last week. If you add up the sales for Tea, Coffee, Herbal Tea and Hot Chocolate we obviously get the sales for Hot Beverages.

A Tree Map takes this idea and expands on it. First, instead of being linked by lines, boxes at level 3 (leaves let’s say) appear within their parent box at level 2 (branches maybe) and the level 2 boxes appear within the overall level 1 box (the whole tree); so everything is nested. Next, the size of each box (at whatever level) is proportional to the value associated with it. Let’s assume that 60% of sales are of Hot Beverages. Then three fifths of the Beverages box will be filled with the Hot Beverages box and two fifths with the Cold Beverage box. If 10% of Cold Beverages sales are Still Water, then the Still Water box will fill one tenth of the Cold Beverages box (or one twenty fifth of the top level Beverages box). Sometimes, rather than having the level 2 boxes, the level 3 boxes might be colour coded, so Tea, Coffee, Herbal Tea and Hot Chocolate might be blue and the rest red.

It is probably obvious from the above, but it is non-trivial to find a layout that has all the boxes at the right size, particularly if you want to do something else, like have the size of boxes increase from left to right.

Chief Analytics Officer (CAO)

An executive charged with most aspects of exploitation of Data in an organisation. Areas typically owned by a CAO would include: Data Science, Data Visualisation, Predictive Analytics, Business Intelligence and sometimes both a Data Service and Regular Reporting. A CAO would not normally be accountable for the control of Data (e.g. Data Governance), with this side of the Data arena owned by a Chief Data Officer. However, either the CAO or the CDO could be the top Data job, with accountability across the whole Data landscape.

See also: The Anatomy of a Data Function – Part I

Chief Data Officer (CDO)

The person fulfilling the top Data job in an organisation and accountable for how Data is both controlled and leveraged in pursuit of executing the organisation’s strategy. The CDO is a business role, but with significant technical experience. It most typically reports to the Chief Operating Officer, but other potential structures could see this role reporting to any number of other top-level CxO roles, including directly to the CEO.

While the CDO retains the accountability described above, they must collaborate with peers across the organisation in order to create stepped-changes in how Data is treated and to promote a culture of reliance on Data to support business decision-making.

See also: Keynote Articles Section 8

Clickstream Analysis (Clickstream Analytics)

A Clickstream is essentially the path that someone browsing a web-site takes through its pages and sections. For a given user (either one logged in to their account and thus tagged with a persistent ID, or a casual visitor, who is typically allocated a one-off ID), it includes actions (such as clicking on a link to another part of the site, clicking on a link to another part of the Internet – e.g. an advertiser, or closing the site) and the time at which these occurred, together with technical information, such as how quickly a page was displayed to a user.

Clickstream Analysis (which is a subset of Web Analytics) is concerned with interrogating Clickstream data in order to:

  • assess the technical performance of a site – e.g. how often did a page fail to load? how many broken links are there?
  • determine how effective it is in achieving its objectives – e.g. how many visits led to a purchase? did users click on adverts? how long do users spend on the site in aggregate? how often do users come back to the site?
  • understand which elements of the site are most attractive to users – e.g. which articles were read in entirety? which articles were most frequently at least partially read? which products had the most people looking at them?
  • get a sense where users have come from to the site and where they go on to from it – which may provide information about interests or highlight good places to advertise

This information can help to improve the experience that users have of a site and, where relevant, to serve up products and services that are more likely to meet a user’s appetite.

Clustering

See Model.

Column Chart

See Chart.

Columnar Database (Column-oriented Database)

In a Relational Database all sales would be gathered into a single Table (or set of related tables). The row is the primary entity in such a Database. Each row of our sales table would have columns such as customer name, product purchased etc. A columnar version of the same Database swaps the emphasis. One structure would have all the customer entries stored together, another all the products. This greatly speeds up the look-up of specific attributes.

Columnar Databases generally support SQL for querying the same as Relational ones. An example of a Columnar Database is Vertica.

Column-oriented Database

See Columnar Database.

Complex Event Processing

This is a way to monitor streams of Data from more than one source, often in real-time, in order to identify threats, opportunities or simply just patterns. An example might be connecting Social Media Sentiment Analysis with the content of call-centre conversations. This might lead to the deduction that these is either an uptick in demand for an organisation’s products or services or that there might be some reputational issue that could have an adverse impact. Some automated trading algorithms in Financial Services might use elements of CEP to identify buy or sell opportunities related to real world events.

Some organisations even layer Business Intelligence solutions over a CEP platform. Flink is an example of CEP from within the Hadoop stable.

Computer Vision

See: Image Recognition.

Some organisations even layer Business Intelligence solutions over a CEP platform. Flink is an example of CEP from within the Hadoop stable.

Conformed Data (Conformed Dimension)

Conformed can almost be viewed as a synonym for standardised. Conformed Data is data which means precisely the same thing in all parts of a Data Repository. So, if there are separate Files or Tables providing customer details, which have different records, or different values within records, then customer data is not conformed. In a more technical sense, pertaining to Data Warehousing, a Conformed Dimension is one which plays exactly the same role for all Fact Tables.

Conformed Dimension

See: Conformed Data.

CRM

See: Customer Relationship Management.

Customer Relationship Management (CRM)

A class of systems designed to support interactions with customers (often in a call-centre and/or sales organisation setting). Because Customer Data is just one class of Data, CRM systems need to be closely integrated with both Systems of Record and Data repositories in order to be accurate and to avoid duplicate entry of Data.

Cube

See Multidimensional Approach.

– D – Return to Index
| Submit your own definition | Consider supporting us |
Dashboard

A Dashboard is a single page or pane (often a web-page) which simultaneously displays multiple different measurements of the performance of an organisation or sub-unit of this (division, department, geographic territory). The Information is generally at a high-level (with the ability to look into more details if required) and at least some of it may be presented in graphical form (e.g. charts, traffic lights, dials and more advanced Data Visualisations).

The content of Dashboards is frequently drawn from an organisation’s KPIs. Dashboards may represent what is happening at a point in time (e.g. month-end) or what is happening now; or both of these perspectives may be mixed (e.g. profit last month versus new business booked up to 5 minutes ago). The term is taken from the instrumentation of cars and aeroplanes.

See also: “All that glisters is not gold” – some thoughts on dashboards

Data

Originally the plural form of the Latin word datum. In itself, datum is a past participle of the Latin verb dare (do, dare, dedi, datus) meaning “to give”; hence words like “donor” and “donate” in English and donner, which is the verb “to give” in French (English “give” comes instead from the German geben).

The word datum means “something that is given” and is used to mean measurements taken, counts performed, or facts known / obtained. Thus Data refers to many such quantities or facts. Archaic usage would suggest forming sentences such as “the datum was gathered” and “the Data were gathered”, however common English long ago embraced Data as a singular / collective noun, so “the Data was gathered” is perfectly acceptable in all but the most pedantic of circles.

With the advent of machines that could store and manipulate measurements and facts (aka computers, electronic or otherwise) the word Data came to be associated with the raw material of electronic processing; originally numbers, text, dates and so on (the text and dates normally being numbers in disguise of course), latterly images, sound, video etc. (also numbers when boiled down to the essentials). Computers store Data (facts and figures) in a variety of ways and use it to create more Data, which can be provided to users, transmitted to other computers, or once more stored. Electronic Data is typically stored in binary format.

Data Analyst

A person who analyses Data. Once more there is no ISO definition, Data Scientists analyse Data, Data Miners analyse Data, Data Modellers analyse Data, Catastrophe Modellers analyse Data and so do a wide range of other people. Here I will use the term Data Analyst to apply to the non-statistical analysis of Data. So a Data Analyst would be involved in sourcing Data, combining different Data sets, cleansing or otherwise filtering Data and producing analyses and graphical exhibits based on it. However such work would fall short of building models from the Data, applying algorithms or other statistical techniques (most Data Analysts could do a simple linear regression if necessary, so the boundaries are not sharp). Such work would tend to be ad hoc. If an analysis becomes one that is needed periodically, the specification would be handed to other staff to productionalise it.

See also: Data Business Analyst.

Data Asset

In accounting, an Asset is a possession of a company that has intrinsic value, for example, unpaid sales invoices, buildings, computer equipment or indeed goodwill. Data Assets are Data owned by a company that also has intrinsic value. This could be because such Data helps to better pilot the organisation, provides Insights that allow the development of new products or markets, allows customers to be better served, or a hundred other things. In some cases, rather than the preceding, which are all essentially intangible assets, Data may have an actual market price, making it all too tangible.

As well as raw Data, structures built out of such Data can also be viewed as Data Assets. Thus each of Data Lakes, Data Warehouses and even Data Models could be Data Assets.

Data Audit

This describes a physical, automated, or (most frequently) mixed review of Data held in either a specific System or Database, or a collection of these forming part or all of an overall systems landscape. The output of this will be varied, potentially systematically highlighting specific Database-level errors or omissions (e.g. missing customer consent fields), pointing out more general issues with the validation of Data on entry or interface, mentioning weaknesses in processes or education and also commenting on any Architectural problems. It is likely that, as well as more granular content, a Data Audit will include some high-level indication of Data health, such as a Red/Amber/Green (RAG) assessment, or commentary as to the current state.

Data Audits may be one-off exercises, or carried out regularly. In the latter case, trends in Data Quality etc. are likely to also feature. In either case, what is imperative is that the findings or Data Audits are acted upon and the outcomes of these are re-audited to ensure that the issues have been properly addressed.

See also: Data Quality.

Data Architecture

(1) The practice of determining business needs, modelling these and mapping them to appropriate Data structures, systems landscapes and integration / interface strategies. Data Architects generally have an in-depth understanding of Data and its usage and so can be more technologically experienced than some architects in other fields.

Data Architects tend to engage with Change programmes, both to instil good Data practice and also to guard against the typically deleterious impact of such programmes on Data Assets over time. They are also heavily involved in the design and implementation of Data-centric capabilities and the delivery of Data to other teams (e.g. Digital).

See also: The Anatomy of a Data Function – Part II and Bumps in the Road

(2) The overall technology and process landscape pertaining to the capture, maintenance, Integration and leverage of Data in an organisation. This would include facilities supporting Data Quality, Master Data Management, Data Repositories, Analytics and so on; supported by Data Governance and related areas.

Database

While it could be argued that this term could be applied to analogue systems such as index cards at a physical library, it is generally taken to refer software that enables the storage and retrieval of numbers and text in digital format, i.e. Data. Databases differ from Flat-files in that they often contain structures (e.g. Tables, Views and indexes) intended to facilitate these tasks and come with tools that enable the efficient management and manipulation of the Data they contain.

Some examples of Databases include:

  1. hierarchical
  2. relational
  3. graph
  4. columnar
  5. in-memory
  6. distributed
  7. NoSQL.

Some of these attributes overlap with each other, i.e. a Database could be both columnar and in-memory, another could be both distributed and NoSQL.

Data Business Analyst

A person who has extensive understanding of both business processes and the Data necessary to support these. A Business Analyst is expert at discerning what people need to do. A Data Analyst is adept at working with Datasets and extracting meaning from them. A Data Business Analyst can work equally happily in both worlds at the same time. When they talk to people about their requirements for Information, they are simultaneously updating mental models of the Data necessary to meet these needs. When they are considering how lightly-documented Datasets hang together, they constantly have in mind the business purpose to which such resources may be bent.

In any Data Programme, the quality of the Data Business Analysts involved is frequently what makes the difference between success and failure. Good Data Business Analysts are rare and should be accordingly treasured.

See also: The Anatomy of a Data Function – Part II, Business Analyst and Data Analyst.

Data Capability

For once the term Data Capability is very close to the everyday meaning of the work “capability”, which relates to having the power, aptitude or know-how to accomplish something. So the Data Capabilities of an organisation reflect its abilities to drive positive outcomes relating to data; e.g. the availability of timely, accurate and pertinent Information is predicated, in part, on competencies in areas such as Data Quality, Data Integration and Data Visualisation.

Typically Data Capabilities are organised into a hierarchy as part of a Data Capability Framework. The top-level of such a framework might include such areas as: Data Strategy, Data Organisation / Operating Model, Data Architecture, Management Information, Analytics and Data Controls; with each high-level capability broken down into sub-capabilities.

See also: A Simple Data Capability Framework.

Data Capability Assessment

See Data Capability Review.

Data Capability Framework (Data Capability Model)

A framework, often visual, organising Data Capabilities into a hierarchy. This may often be in the context of work to assess existing Data Capabilities or desired future ones.

See also: A Simple Data Capability Framework.

Data Capability Model

See: Data Capability Framework.

Data Capability Review (Data Capability Assessment)

A structured process aimed at assessing the current Data Capabilities of an organisation (generally against a Data Capability Framework), the desired future Data Capabilities, or both. The current state assessment will identify strengths, weaknesses, opportunities and risks associated with the data landscape (cf. Data Maturity); often accompanied by recommended actions. Such work is often an element of broader activities to create a Data Strategy.

See also: A Simple Data Capability Framework, Data Strategy Creation – A Roadmap and Measuring Maturity.

Data Catalogue

[US: Data Catalog] A Data Catalogue is a mechanism for indexing, tagging and documenting sets of data in a Data Repository (typically a Big Data one, such as a Data Lake) that supports searching and typically will also have facilities for users to rate or comment on data-sets, providing assistance to future users in their searches. The overall concept is not very far away from Amazon’s on-line store.

See also: Data Marketplace.

Data Category

See Data Classification.

Data Classification (Data Category)

This refers to categorising – and sometimes tagging – Data in order to separate out what it is used for, how it is treated, where it is stored and a variety of other purposes. A canonical classification might be to do with elements of Security or Privacy, with Data being split into, say, highly sensitive (e.g. medical records), confidential (e.g. contracts and maybe certain transactions), personally identifiable (e.g. names and contact details) and less restrictive categories, including even publicly available. A further classification might apply different archival and retention timeframes to different types of Data. Classification could also be for technical reasons, like ensuring that frequently used Data has its speed of access optimised.

Data Cleansing

At the positive end of things, this can refer to the harmless (and useful) activity of de-duplicating records, fixing inconsistencies in capitalisation, quarantining Data with issues for later review and so on. At the other end of the spectrum we have less helpful (and often harmful) activities that could include picking values to fill empty fields, permanently excluding records, or recalculating figures according to some improved formula. In the author’s opinion, these all present a slippery slope leading to Data massaging and should be either used very sparingly or avoided altogether.

This advice stands for the statistical use of Data as well as operational. Some of the above activities can skew models and create selection bias.

See also: Using BI to drive improvements in Data Quality

Data Community

An organisation-wide “coalition of the willing” encompassing a wide range of people who work with data in their day-to-day jobs. This would include members of a formal Data Function, but also people like Management Information analysts, report writers, geospatial analysts, people engaged in Statistical Modelling, Excel jockeys and all types of Data Wranglers drawn from all over the organisation, both geographically and by function. The idea here is that there tends to be a large number of people involved in using data and it makes sense to help each other out. Data Communities can also be vehicles for nudging an organisation towards sensible common standards and methodologies and even common tooling.

See also: In praise of Jam Doughnuts or: How I learned to stop worrying and love Hybrid Data Organisations

Data Consistency

Rather tautologically, this refers to consistency of Data; which has a connection to Data Integrity. This may be at various levels. At an overall architectural level, an example might be that sales from a Retail system are properly reflected in an Accounting system, or in an underlying Database. Also where, for speed of access, the same Data is mirrored to different Databases (e.g. in different countries), Data Consistency would relate to ensuring that changes to one local copy are reflected in all other copies and maybe a central master. Data Consistency can also be at the level of a single Database, with Referential Integrity being an example from the world of Relational Databases.

Data Consistency is also very important when moving Data from Transactional Systems to reporting or Analytic ones, or indeed when taking a backup. The focus is on ensuring that, if a certain event updates both Table A and Table B, either the pre-update, or post-update version of both is moved, rather than Table A reflecting the event and Table B not.

Data Controller

Under GDPR, a Data Controller is an organisation who is accountable for the collection, storage, use and deletion of data belonging to individuals, known as Subjects. The Data Controller would have the primary relationship with the Subject and determines the use of the Subject’s data, but they may cede the actual processing of data to a third party, known as a Data Processor.

For example, Josephine has a bank account with Big Bank plc. Big Bank plc outsource elements of their bsuiness operations, systems and data processing to Bengaluru Consulting Services Ltd. Here Josephinbe is the Subject, Big Bank plc is the Data Controller and Bengaluru Consulting Services Lts. is the Data Processor.

Data Controls

These form one aspect of overall Information and Data Governance as well as being related to each of:

Controls are procedural or system-based checks on how Data is processed, which are aimed at ensuring that this is done appropriately and in a manner that serves business needs, protects customers and business partners and complies with legal and regulatory requirements. Some Data Controls are applied in real-time, for instance they may be added to Transactional System validation. A Data Control procedure might also entail a Data entry person referring to a manual or user guide to ensure that they are entering Data correctly. Other Controls may be retrospective such as Data Quality reports or Data Audits.

Data Curation

Contributor: Tenny Thomas Soman

A collection of processes, tools and techniques to manage and maintain Data across its lifecycle; from the time Data is mastered through to Integration, provision and consumption of Data with a continuous focus on improving the value and usability of Data incrementally over time. Data Curation has increased relevance with the emergence of Data Lakes which typically Ingest all/most Data from the various sources, but Data will be curated over time as and when use cases are identified and the characteristics of the underlying Data are discovered.

See also: Draining the Swamp and Convergent Evolution.

Data Democratisation

This describes a process of making Data (and Information) more widely available in an organisation and, in particular, to non-specialist staff. Such a process is necessary where previously specific IT skills and security rights were necessary in order to access Data. Of course such access needs to come will appropriate controls from a Security and regulatory perspective.

Data Dictionary

No, this is not a self-referential definition (this page is actually more accurately described as a Data Glossary in any case). Instead a Data Dictionary is a set of entries describing the elements of a Database (or part of it). For a Relational Database, this would include Tables, Views and perhaps indeces. Considering the example of a Table, the Data Dictionary would include:

  • the name of the Table and its purpose (e.g. to store invoices)
  • the name of all columns, the type of Data they holds and any rules around this (e.g. it must equal a column entry on another Table)
  • a description of any Tables to which this Table is related

Of course to be useful, Data Dictionaries need to be kept up-to-date, reflecting the current state of a Database, not some prior one. This should be the subject of a Data Control applied to any Database work.

Data Discovery

A process by which generally numerate, but not necessarily technical, staff are able to explore (generally Curated) Datasets, perform their own analyses and create their own reports. This term can also refer to interactions with facilities such as highly parameterisable reports or customisable Dashboards in order to develop a personally-relevant view of Information. Data Discovery often relies upon good Metadata.

Data Domain

Contributor: Taru Väre

A Data Domain is a logical grouping of data. Each Domain consists of one or more data entities which can be controlled and managed in a similar way. Grouping data entities into Data Domains is the way to define ownership, rules and policies in an organisation. Domains are often used in Master Data Management, where typical Domains might include “customer” or “product”.

Data Driven

An epithet often applied to the situation where the operations of an organisation are guided by reliable, timely and pertinent Insight and Information at both a strategic and day-to-day level. In a Data Driven organisation, data is at the heart of everything, rather than an occasionally useful side activity.

See also: Building Momentum – How to begin becoming a Data-driven Organisation.

Data Engineering

Essentially a support function for Data Science. If you consider the messy process of sourcing Data, loading it into a repository, cleansing, filling in “holes”, combining disparate Data and so on, this is a somewhat different skill set to then analysing the resulting Data. Early in the history of Data Science, the whole process sat with Data Scientists. Increasingly nowadays, the part before actual analysis begins is carried out by Data Engineers. These people often also concern themselves with aspects of Master Data Management and Data Architecture.

In recent years, there has been something of a coming together of Data Science-focussed Data Engineers and Extract, Transform Load people, who traditionally work with Data Warehouses. Sometimes these people are grouped together, often under the umbrella of Data Engineering, with some team members being specialists and others generalists.

Data Enrichment

Data Enrichment describes the process of merging datasets to create a new and more valuable set of data. Typically external data (for example demographic data) may be combined with internal transactional data to (again for example) allocate customers to a specific demographic category. Or external mapping data might be combined with a customer’s post code (zip code) data in order to place their residence on a Data Visualisation. In either case, you end up with a dataset that can be used in ways that the original could not.

Data Ethics

The practices and policies of an organisation that ensure that Data is used not only in a way that is compliant with regulations, but in an ethical manner; generally one that would stand up to external scrutiny. This involves questions such as: “Is customer Data used in a manner that the customer would approve of?”, “How do we use Data to provide better products or services to our customers without appearing intrusive or manipulative?” and “What decisions relating to business partners do we make using Data and what principles underpin these?”

See also: In-depth with Christopher Bannocks

Data Federation

Data Federation is a type of Data Virtualisation. What Data Federation typically does in addition to vanilla Virtualisation is to apply a consistent Data Model across the different source Databases.

Consider an example where Database A contains a table, Table 1, of customer payments and physically separate Database B contains a table, Table 2, also of customer payments. Data Virtualisation will allow a user to seamlessly access Table 1 and Table 2 as if they were in the same Database. Data Federation will allow users to access Table 3 which contains the customer payment details held in Tables 1 and 2 (or at least to access Table 1 and Table 2 with their contents made consistent).

Data Function

A Data Function is a team of people dedicated to taking all aspects of the data arena forward at an organisation. Such teams will have responsibilities ranging from Data Science and Machine Learning; to Analytics, Business Intelligence and Data Visualisation; to Data Governance, Data Management and Data Quality improvement. These areas will be underpinned by a focus on Data Strategy (development and execution), Data Architecture and Data Operating Model. In some organisations, the members of a Data Function are co-located; in others the team is spread across multiple offices or indeed countries. There are advantages and drawbacks to both arrangements, but in either case the Data Function needs to operate as a cohesive whole. Equally, in some organisations, the Data Function will have direct responsibility for all aspects of data; whereas in others, such responsibility may be shared with other groups, e.g. analytics teams embedded in business functions, the Risk department or parts of the IT organisation.

Data Functions can be led by people with a range of titles, but most commonly a Chief Data Officer.

See also: The Anatomy of a Data Function: Part I, Part II and Part III.

Data Governance

The management processes, policies and standards necessary to ensure that Data captured or generated within an organisation is of an appropriate standard to use, represents actual business facts and has its integrity preserved when transferred to repositories (e.g. Data Lakes and / or Data Warehouses, General Ledgers etc.), especially when this transfer involves aggregation or merging of different Data sets. The activities that Data Governance has oversight of include the operation of and changes to Systems of Record and the activities of Data Management and Analytics departments (which may be merged into one unit, or discrete but with close collaboration).

Data Governance has a strategic role, often involving senior management. Day-to-day tasks supporting Data Governance are often carried out by a Data Management team.

See also: The Anatomy of a Data Function – Part II, 5 More Themes from a Chief Data Officer Forum and Bumps in the Road

Data Governance Committee

A Data Governance Committee is a group of people who are collectively accountable for (amongst other things):

  • Approval of the Data Governance Strategy and Data-related Policies
  • Approval any structural work / projects in the area of Data Governance
  • Periodic review of Data Controls
  • Review of any recent Data Incidents
  • Review the current status of Data Quality and of any plans to improve this
  • Review of proposals for changes to Data Architecture
  • Review of any data-centric matters arising from the Change Portfolio
  • Review and prioritisation of open Data Issues – identifying those that should be the subject of remediation in the next relevant period (e.g. quarter)
  • Periodic review of the cost and efficacy of Data Governance arrangements

The Data Governance Committee is generally chaired by the most senior Data Governance person in the organisation (e.g. The Head of Data Governance) and comprised of the Data Owners and other interested parties (e.g. there may be IT or Change representation, the CDO may attend etc.). The members are typically senior people as they need to be able to help to effect change in the organisation, to navigate around blockages and, where necessary, to allocate funds to Data Governance-related work.

Data Governance Committees meet periodically with the frequency set by business need. They are normally formal decision forums whose proceedings are minuted and part of business records. Often such committees are suported by a Data Governance Working Group, which meets more frequently and is attended by Data Stewards.

Data Governance Framework

Generically a framework is a structure within which you place things in order that they form a coherent part of an overall whole. Similarly, a Data Governance Framework is the aggregation of organisation structures, processes, controls and sometimes systems that support Data Governance. From an organisational point of view, a network of Data Owners and Data Stewards (together with the forums they interact in) would play a central role in such a framework. Processes such as the peer-review of entered data or the training of new starters in how to use an organisation’s systems would also contribute. A robust approach to Data Issue Management would also be a typical framework element. Activities such as Data Classification or Data Lineage also fall into the framework.

Data Governance Working Group

A Data Governance Working Group, as the name applies, is a working group focussed on Data Governance. It typically sits under a Data Governance Committee and typically meets more frequently. Rather than the Data Owners populating the Data Governance Committee, the Data Governance Working Group has Data Stewards as its primary members; but some people will attend both (e.g. both would typically be chaired by someone like a Head of Data Governance).

To begin to understand the work of a Data Governance Working Group, one way of proceeding is to take the accountabilities of the Data Governance Committee and make them responsibilities instead. The topics are generally more granular and can be more operationally focussed, but of a similar type to the more senior meeting.

Data Ingestion

The process of bringing raw, untransformed Data into a Big Data repository, such as a Data Lake.

Data Integration

Bringing together Data from different sources into a cohesive whole. This can involve processes like Extract Transform and Load, creating Views combining multiple tables in a Relational Database, or generating new physical Data structures duplicating several existing ones in Hadoop.

Data Integrity

Related to the concept of Data Quality, but generally thought of as more holistic in nature. For example, server malfunction or fires in Data Centres would be something that a Data Integrity specialist might worry about. In addition, while some people use the two terms interchangeably, but Data Integrity often emphasises not only the correctness and completeness of individual Data items, but that they are related properly to other relevant Data items, encompassing things like Referential Integrity. An area of focus for Data teams is often to preserve Data Integrity through the processes of it being collated with other Data and transformed to either adhere to a consistent Data Model or to better represent actual business events.

Data Issue Management (DIM)

This is a part of a Data Governance Framework and refers to processes, systems and meetings surrounding Data Issues. Data Issue Management encompasses the capture of Data Issues in a register, their investigation / analysis, design (and costing) of remedial actions, the prioritisation of these (often by a Data Governance Committee) and oversight of work to address the issue. DIM also includes tracking and reporting on Data Issues.

Data Lake

A Big Data repository in to which copies of source systems are periodically replicated. The Data Lake is the one of the resources that Data Scientists leverage to create Insight.

Data Lineage

There may be a long and circuitous trip from when Data is first entered into a System of Record (or interfaced into it) and it appearing on – for example – a Dashboard. Data Lineage is about documenting this journey. Thus it will first describe where Data was initially captured, in which system, table and field. Next it will cover how this Data has moved about, for example, being interfaced to a second system, or picked up and transferred by ETL code. In particular Data Lineage will also catalogue any changes to Data, for example Data Cleansing, or the allocation of values to empty fields etc. Data Lineage can be thought of as a genealogy of Data items appearing in reports and analyses.

Data Management

The day-to-day management of Data within an organisation, which encompasses areas such as Data Architecture, Data Quality, Data Governance (normally on behalf of a Data Governance Committee) and often some elements of Data provision and / or regular reporting. The objective is to appropriately manage the lifecycle of Data throughout the entire organisation, which both ensures the reliability of Data and enables it to become a valuable and strategic asset.

In some organisations, Data Management and Analytics are part of the same organisation, in others they are separate but work closely together to achieve shared objectives.

See also: Alphabet Soup and Data Management as part of the Data to Action Journey

Data Marketplace

An adapted version of a Data Lake which is distinguished by being Curated, both by experts and – to a more limited degree – regular users; by having a robust Catalogue of Data-sets, which again users can help to maintain; and by having a front-end analogous to an on-line store where users can search for Data, access it and provide feedback / ratings on its usefulness, helping others to zero in on the most valuable and pertinent Data-sets. Think Amazon for Data.

See also: Draining the Swamp and Data Catalogue.

Data Mart

Part of a Data Warehouse devoted to a specific subject area, e.g. Finance, Sales etc.

Data Maturity

An assessment of the aggregate Data Capabilities of an organisation, typically with reference to a Data Capability Framework. Ordered tiers of Data Maturity can be used to form a Data Maturity Model, which allows organisation to see where currently sits versus where it aspires to be with respect to data.

See also: Measuring Maturity.

Data Maturity Model

A diagram cataloguing of a number of strata of high-level Data Maturity levels, presented in order from less mature to more mature and often employing visual metaphors such as ladders or staircases. Where an organisation currently sits with respect to its overall Data Maturity may be plotted on such an exhibit and often contrasted with their aspirations for future enhanced Data Maturity. Such a model is generally based on a Data Capability Framework and forms one output from a Data Capability Review.

See also: Measuring Maturity.

Data Migration

The process of moving Data from one place to another, often a legacy system to a new one, or from old Data Repositories to a new one. This requires a very good understanding of the structure of Data in both the source and target systems and may involve elements of Data Integration.

Data Mining

The process of sifting through generally large Data sets to discern meaning, uncover new facts and relationships and establish useful patterns. There is a connection here to some of the activities carried out by Data Scientists, though some aspects of Data Mining may be automated. Data Mining may leverage Big Data implementations, but has been carried out successfully on other types of Databases for many years before the advent of these.

Data Model

A Data Model is a diagram which documents how various elements of Data (e.g. a business entity, such as “customer” or a more physical entity such as a set of “customer” Tables) fit together with other elements (e.g. “customer orders”) and relate to whatever is being modelled, e.g. a business process or type of transaction. Data Models can have different levels of abstraction. Some may deal only with high-level business descriptions, others may delve into how these are represented in actual Databases.

Types of Data Model used for different purposes include:

Data Modelling

The process of examining Data sets (e.g. the Database underpinning a system) in order to understand how they are structured, the relationships between their various parts and the business entities and transactions they represent. While system Data will have a specific Physical Data Model (the tables it contains and their linkages), Data Modelling may instead look to create a higher-level and more abstract set of pseudo-tables, which would be easier to relate to for non-technical staff and would more closely map to business terms and activities; this is known as a Conceptual Data Model. Sitting somewhere between the two may be found Logical Data Models. There are several specific documents produced by such work, one of the most common being an Entity-Relationship diagram, e.g. a sales order has a customer and one or more line items, each of which has a product.

See also: The Anatomy of a Data Function – Part II

Data Operating Model

An Operating Model is a description of how an organisation works; the things it does, the way that it does them and the people, process and technology involved. There is often a focus on the value delivered. As well as describing the current state, Operating Models are often developed as a guide to a desired future state; in this circumstance the term Target Operating Model (or TOM) is often employed. TOMs are often drawn up as a precursor to transformation programmes or organisational redesign.

Simply put, a Data Operating Model (target or current) is a similar description of how Data contributes value to an organisation. As such it will cover not only those people explicitly devoted to the data arena (typically a Data Function) but how data is part of the operations of all parts of the organisation. Like its non-specific brethren, a Target Data Operating Model is often used to guide data transformation programmes.

Data Owner

A senior person (often an Executive or other Senior Manager) who is accountable for one or more Data Assets in an organisation. This is generally as part of a Data Governance Framework. Areas that a Data Owner would be responsible for might include: Information Security, Data Privacy, Data Quality and more general Data Controls. They may also be accountable for driving adoption of data facilities (such as a new Dashboard) and realisiation of benefits to do with data (e.g. improved results in their area of the business due to the application of Analytics).

Data Owners tend to operate at a strategy and policy level. They are often supported in their duties by Data Stewards, who are more involved in day-to-day data-related activities.

Data Platform

A Data Repository, together with the software tools, (optionally) code environment and interfaces necessary to Populate it, manage it and Integrate it with other Repositories and/or systems. Data Platforms may also contact Analytical or Reporting capabilities, or easy integration with these. It should be evident that a Data Platform has much greater functionality than just a Database.

Data Processor

Under GDPR, a Data Processor is an organisation who sub-contracts work processing data beloning to individuals (Subjects) for a second organisation, which has the primary relationship with their Subjects. The second organisation defines how Subject data is to be processed by the Data Processor an is called a Data Controller.

For example, Josephine has a bank account with Big Bank plc. Big Bank plc outsource elements of their bsuiness operations, systems and data processing to Bengaluru Consulting Services Ltd. Here Josephinbe is the Subject, Big Bank plc is the Data Controller and Bengaluru Consulting Services Lts. is the Data Processor.

Data Privacy

This pertains to Data held by organisations about individuals (customers, counterparties etc.) and specifically to Data that can be used to identify people (personally identifiable Data), or is sensitive in nature, such as medical records, financial transactions and so on. There is a legal obligation to safeguard such Information and many regulations around how it can be used and how long it can be retained. Often the storage and use of such Data requires explicit consent from the person involved.

All B2C organisations hold Data about their customers (or potential customers, e.g. those who have made and enquiry). This can range from actual transactions with the company, to non-transactional contact (e.g. queries placed with a call centre), to web-site interactions. While it is necessary to hold at least some of this Information in order to properly service the customer, privacy laws (and general ethics) dictate that it should be used in an appropriate way (generally defined as one that the customer has explicitly sanctioned) and not released to either any third party or people in the B2C organisation who have no need to know such details. In general B2C organisations are also meant to retain customer Data only so long as it is pertinent to servicing the customer’s needs. Similar arguments pertain to B2B organisations and the details that they hold of partner organisations, but this is less subject to regulation than customer Data.

One use of such customer Data is to perform Analytics or Statistical Modelling on it in order to better understand customer behaviour and preferences so as to aid retention, increase new business and offer more pertinent and useful products and services. Data Privacy generally dictates that such work must be on Data sets that are aggregated with any Information that could potentially be used to identify individual customers being anonymised. Though models in this areas may be used to segment existing customers into cohorts (e.g. higher risk appetite, outdoor fan, etc.), which does not in general infringe privacy law.

Laws to protect Data Privacy are becoming more stringent, the potential sanctions more material and the risk of major reputational damage more real. All of this has led organisations to invest time and resource into policies, practices and systems designed to bake Data Privacy compliance into day-to-day operations.

There is some overlap with Information Security, but the two areas are essentially distinct with different priorities and objectives.

See also: The Anatomy of a Data Function – Part III.

Data Protection

Data Protection is in many ways synonymous with Data Privacy. The term is used most often in connection with the European Union’s General Data Protection Regulation (GDPR).

Data Protection Officer (DPO)

GDPR mandates that certain types and sizes of organisation appoint a Data Protection Officer (DPO). This is a senior manager accountable for compliance with GDPR. Many organisations not specifically covered by this GDPR mandate have nevertheless chosen to create DPO roles. DPOs tend to collaborate closely with other data-centric roles, such as Chief Data Officers and Information Security personnel.

Data Quality

The characteristics of Data that cover how accurately and completely it mirrors real world events and thereby how much reliance can be placed on it for the purpose of generating Information and Insight. Enhancing Data Quality should be a primary objective of Data Management teams. Ways that this can be achieved include:

  1. Data Audits – so long as the loop is closed when issues are discovered
  2. Data Education – to explain to people entering Data how it is used and its importance to the organisation
  3. Data Validation – improving how systems validate input or interfaced Data, potentially in combination with an approach to Master Data Management
  4. Data Architecture – improving how systems are designed and talk to each other
  5. Data Transparency– taking a “warts and all” approach to how bad Data is included in reporting and dashboards

See also: The Anatomy of a Data Function – Part II, Using BI to drive improvements in Data Quality and Who should be accountable for Data Quality?

Data Roadmap

A high-level vision / plan for how to enact a Data Strategy. This will normally cover major workstreams and objectives and will typically cover a number of years.

Data Repository

A generic term for any structure for holding a collection of, normally related, Data. This would encompass Databases, Data Lakes, Data Marts and Data Warehouses.

Data Science

Data Science is a term that covers a range of activities from the collection, transformation and combination of data, through exploring this to derive Insight, to applying similar Statistical techniques to those used in actual science to identify patterns, exceptions or relationships, ones that would often not be apparent via normal Data Analysis. It also encompasses developing Statistical Models, fed by the data collected, and leveraging more advanced techniques from the previously academic field of Artificial Intelligence, including Machine Learning, Natural Language Programming and others. It also includes is the presentation of either data or the output of models using either traditional techniques, such as Dashboards, or more advanced Data Visualisations.

Data Scientist

Someone au fait with exploiting Data in many formats from Flat Files to Data Warehouses to Data Lakes. Such individuals possess equal abilities in the Data technologies (such as Big Data) and how to derive benefit from these via statistical modelling. Data Scientists are often lapsed actual scientists.

See also: The Anatomy of a Data Function – Part I and Knowing what you do not Know

Data Scrubbing

A vigorous (sometimes too vigorous) form of Data Cleansing.

Data Service

The provision of Data (or higher-value Information) by a Service, a dedicated piece of code whose sole purpose is to provide the Data it covers when requested by another piece of code. A Data Service will be implemented in a “black box” manner, the code that calls it does not need to know anything about how the Data Service sources or manipulates its Data, just how to call it and what it returns. Data Services are just one type of service which form part of a Service-oriented Architecture, one in which different applications communicate seamlessly with each other.

Data Sourcing

Data Sourcing is the process of acquiring Data from various Data Repositories, Databases underpinning Transactional Systems, web-site logs or other flat-file outputs, APIs, or external data sources. This can be done on a one-off basis or regularly, e.g. weekly. Typically the data sourced would be saved somewhere for later use (e.g. a spreadsheet or another Database), but equally just the rules and processes needed to acquire it may be saved allowing these to be run on demand.

Data Sourcing is normally the first element of Data Wrangling or Extract Transform and Load.

Data Steward

This is a concept that arises out of Data Governance. It recognises that accountability for things like Data Quality, metadata and the implementation of Data policies needs to be devolved to business departments and often locations. A Data Steward is the person within a particular part of an organisation who is responsible, on a day-to-day basis, for ensuring that their Data is fit for purpose and that their area adheres to Data policies and guidelines.

Data Stewards will typically have a reporting relationship to a Data Owner, who focuses on similar areas but from more of a strategic perspective.

Data Strategy

Unsurprisingly, this is strategy applied to Data. My definition of strategy is as follows:

[…] something which seeks to influence the future, to bring about some conditions or cause an event, neither of which would manifest themselves without some action being taken.

Excerpted from: Forming an Information Strategy: Part I – General Strategy

A sound Data Strategy should consider the current state of the organisation with respect to the capture, manipulation and usage of Data (this involves assessing systems, processes and people’s behaviour), identity some future state which will result in superior business results (addressing issues with the current state and/or seizing new opportunities) and map out a way to move between the two. The superior business results are crucial. A Data Strategy is first and foremost a business strategy and must have clear business drivers and clear business outcomes.

On the assumption that the business focus is there, then a Data Strategy will typically cover what the future organisation will look like from a Data perspective. This should include: Data processes and controls (related to Data Governance); Data consistency, Integration, reuse and Data Quality; all underpinned by an overall Data Architecture. While tools are not the most important aspect of any Data Strategy, it makes sense to cover how Data Visualisation, Analytics and Business Intelligence will be supported as well as at least sketching out some of the back-end tool requirements.

On the human side, the Data Strategy will cover how people across the organisation are intended to access and leverage Data, there also needs to be some thought about teams dedicated to the Data arena. Will there be a Data Science team? Is a centralised Data Function necessary? And so on. Finally a good Data Strategy will highlight the need for strong educational and communications elements to any work undertaken.

See also: How to Spot a Flawed Data Strategy and Building Momentum – How to begin becoming a Data-driven Organisation

Data Virtualisation

If the Data Warehouse paradigm is to gather all source Data together in one place, Data Virtualisation instead leaves it where it was (or – more likely – in mirror copies of each system’s Data, in order to prevent transaction processing from being impacted by queries) and instead brings the Data together only when read. The term Virtualisation arises because this is like creating a virtual Data Warehouse.

A primary advantage of Data Virtualisation is that it can utilise quasi-real-time Data (as up-to-date as the mirror Databases are). This can be helpful for potentially rapidly changing Data, like customer Data.

See also: Data Federation

Data Visualisation

Techniques – such as graphs – for presenting complex Information in a manner in which it can be more easily digested by human observers. Based on the concept that a picture paints a thousand words (or a dozen Excel sheets).

See also: The Anatomy of a Data Function – Part I and Data Visualisation – A Scientific Treatment

Data Warehouse

A Database holding Data from many disparate sources in a common format which allows the comparison of apples and oranges. A regular warehouse is a big building in which many things may be stored, but which has an indexing system which allows them to be located and retrieved easily. A Data warehouse is essentially the same concept. Good Data Warehouses have business meaning “baked” into them. Data Warehouses generally follow a Multidimensional Paradigm (related to OLAP) where Data is held in Fact Tables (tables covering numbers such as revenue or costs) and Dimensions (things we want to view the facts by, such as region, office, or week).

See also: Using multiple business intelligence tools in an implementation – Part I and Part II

Data Warehouse Appliance

A dedicated server which is tuned to carry out Analytical tasks very quickly. Transactional servers will be tuned to either create new records or update existing ones. Appliances are tuned to select all records with a given attribute quickly. This is often achieved by using Massively Parallel Processing. Products from IBM Netezza and TeraData are examples of Data Warehouse Appliances.

Data Wrangling

Contributor: Tenny Thomas Soman

The process of Cleansing, mapping and transforming raw Data into a format suitable for Exploration and Analytics. Data Wrangling has emerged due to an increased need for self-service capability to enable Analysts and business end-users to explore and exploit Data quickly. Data Wrangling tools complement ETL tools within the Data landscape with ETL solutions supporting enterprise wide Data Integration and transformation requirements and Data Wrangling tools enabling business focused exploratory and iterative use cases. Data Wrangling is often an activity carried out by Data Scientists or Data Engineers.

See also: The Anatomy of a Data Function – Part I and Convergent Evolution.

Decision Model (Decision Tree)

The term Decision Model is used in many contexts. Generally this is a tree-like structure with a Yes / No decision (or similar binary outcomes) at each branching point together with rules or questions to determine which path is taken. However, some Decision Models instead essentially look to Optimise a set of variables in order to reach some outcome (or avoid some other one). Broadly Decision Models are designed to help determine the best course of action in a given set of circumstances. From a Data & Analytics point of view, Decision Model refers to a model which employs Predictive Analytics to guide either each of the Yes / No decisions or the Optimisation process. Such models are typically iterative in nature.

Decision Tree

See: Decision Model.

Deep Learning (Deep Neural Network)

Deep Learning is a subset of Machine Learning. Its main feature leads to an alternative description of Hierarchical Learning.

Animal brains consist of neurons, each of these receives input signals via one or more dendrite and passes potentially modified output signals on via one or more axon, which in turn connect with the dendrites of other neurons. In this way, when one neuron “fires”, it may have an impact on several other downstream neurons. Within AI, the creation of physical neural networks and latterly in silico ones has been an active area of study; particularly in fields such as image recognition and interpretation.

Deep Learning utilises the hierarchical arrangements of neural networks, where each neuron is a virtual processor (or analogous arrangements where mini-algorithms play a role similar to these artificial neurons), but on a the larger scale possible with more modern computers. The general intention is that Data – whose underlying structure is unknown – is fed into the basal layer and, as output from this iteratively become input to higher layers, meaning – i.e. a structure to the input Data – begins to emerge.

The general concept is that complicated Insights (high up the hierarchy) are built up from simpler ones (derived lower down). The number of layers can vary and different layers can be supervised or unsupervised by human “trainers”.

Deep Neural Network

See: Deep Learning.

Digital [Department]

Digital is the name often given nowadays to the part of a company that deals with its web-presence and mobile applications; i.e. is concerned with creating content for web-sites and tablets. Historically, Digital used to be a preserve of the IT function, often it is now a stand-alone area, often closely aligned with, or indeed part of, Marketing. A Digital department will have its own in-house people, but will often outsource most of the heavy lifting to one or more Digital Agency, which will have the whole range of capabilities from design and creatives to build and run.

Given that Digital front-ends nearly always have to interface with internal systems, Digital will work closely with IT. They will typically also have a Web Analytics area, which may have a formal or informal relationship with an Analytics team within a Data Function.

See also: The Anatomy of a Data Function – Part III.

Dimension

See Multidimensional Approach.

Distributed Data

Data held across multiple computers, generally coupled with software which makes this seem as if it was held in one place.

– E – Return to Index
| Submit your own definition | Consider supporting us |
ELT

See Extract Load Transform.

Embedded BI / Analytics

Embedded BI or Embedded Analytics can refer to two things. First the situation where use of modern, easy-to-use tools and the business-centric and reconciled data underpinning them has become a part of the corporate DNA. In these circumstances, people would no more take a decision without finding out what the data tells them than they would forget to breathe.

Second, the organisational arrangements where Analytic staff and even Data Scientists are embedded in specific business units and support functions and focussed on helping them to achieve their objectives. These arrangements work best when such federated teams are complemented by a central Data Function and a broader Data Community is created.

See also: In praise of Jam Doughnuts or: How I learned to stop worrying and love Hybrid Data Organisations.

End User Computing (EUC)

This is a term used to cover systems developed by people other than an organisation’s IT department or an approved commercial software vendor. It may be that such software is developed and maintained by a small group of people within a department, but more typically a single person will have created and cares for the code. EUCs may be written in mainstream languages such as Java, C++ or Python, but are frequently instead Excel- or Access-based, leveraging their shared macro/scripting language, VBA (for Visual Basic for Applications). While related to Microsoft Visual Basic (the precursor to .NET), VBA is not a stand-alone language and can only run within a Microsoft Office application, such as Excel.

With the democratising of programming skills in recent years, some EUCs may be well-written, documented, robust and highly performant. However this is not always the case and many EUCs are poorly designed and hard for others to understand, making it difficult to tell whether or not they reliably produce the desired results. EUCs typically arise in departments with strong reliance on Excel, a need to get things done quickly and an innate distrust of IT Departments. This combination of factors means that the most frequent home for EUCs is Finance departments and related areas (e.g. Actuarial Departments in Insurance, Credit Risk in Retail Banks).

There is nothing inherently wrong with an EUC approach and there are many gifted programmers who do not sit in IT departments. However – particularly given the fact that many EUCs are critical parts of processes that generate statutory or regulatory returns and thus potentially present significant risks – there has been a focus on either securing or replacing them in recent years.

See also: The Anatomy of a Data Function – Part III

Enterprise Resource Planning (ERP)

Systems (or a single system) covering the Financial aspects of an organisations activities from Accounts Payable and Receivable to Fixed Asset Management, Cash Management and General Ledger functions / Corporate Consolidation.

See also: “Why do CFOs and CEOs hate IT? – ERP” – Thomas Wailgum at CIO.com

ERP

See: Enterprise Resource Planning.

ETL

See: Extract Transform Load.

EUC

See: End User Computing.

Extract Load Transform (ELT)

Rather than the Extract Transform Load paradigm inherent in Data Warehousing, Big Data implementations tend to change the order of these processes. Data is “lifted and shifted” wholesale to a Big Data repository (e.g. a Data Lake) and held in original format. It is only transformed “on the fly” when needed by Data Scientists.

In practice, things are not so black and white. Many Data Lakes contain intermediate merged and transformed Data structures, not least to ensure that each Data Scientist doesn’t repeat the same work, or carry it out in a different way.

Extract Transform Load (ETL)

Extract Transform and Load is the term applied to a class of software tools which pretty much do what you would expect from the name. They are designed to manage the process of taking Data from one Database, manipulating it so that it is consistent with a pre-defined structure, potentially combining it with Data from other Databases and loading it into areas of a Data Warehouse or Data Mart from which it can be leveraged by reporting and analysis tools.

The work that ETL tools do was previously carried out in a more manual manner, normally involving SQL. ETL tools allow their users to take more of a top-down design-driven approach and facilitate the documentation and control of code. They also generally have highly specialised elements designed to carry out the merging and aggregation of Data quickly and efficiently.

See also: The need for collaboration between teams using the same Data in different ways

Explainable AI

Contributor: Tenny Thomas Soman

An emerging theme within the Artificial Intelligence (AI) domain that focuses on building Artificial Intelligence systems that have the ability to explain the characteristics and rationale that underpin their results/recommendations. Focus is on improving transparency associated with the AI systems/models and thereby increasing business confidence in the models to supporting enhanced adoption within the organisation.

– F – Return to Index
| Submit your own definition | Consider supporting us |
Fact Table

See Multidimensional Approach.

Flat-file

A simple text file stored directly on disk with no other structure (i.e. the file is not part of a Database). If you output and Excel sheet in comma separated format, this is one type of flat file.

Flink

More properly Apache Flink. This is a framework for processing separate streams of Data, often for the purpose of supporting Complex Event Processing.

– G – Return to Index
| Submit your own definition | Consider supporting us |
GDPR

See General Data Protection Regulation.

General Data Protection Regulation (GDPR)

This margin is too narrow to include a comprehensive review of the European Union’s General Data Protection Regulation, or GDPR. The tenacious and legally-minded may wish to review the entire text here. Broadly this regulation lays out the rights of individuals pertaining to their Personal Data, together with the permissible legal bases for organisations to store and use the same type of data.

A person whose data is covered by GDPR is referred to as a Subject an an organisation collecting and processing a Subject’s data is referred to as a Data Controller (who may sub-contract / outsource work to a Data Processor). Subjects are granted a number of rights under GDPR, which include the right to:

  1. access Personal Data held by a Data Controller
  2. have a Data Controller explain the uses that their data is put to
  3. have any inaccuracies in Personal Data fixed
  4. in some situations, have Personal Data erased

The legal bases under which a Subject’s data may be stored / processed are where:

  1. the explicit consent of the Subject has been obtained; this must generally include the specific usage of their Personal Data as opposed to a vague agreement
  2. the Subject’s Personal Data is required to either agree or discharge a contract with them
  3. the Data Controller has a legal obligation to store / process the Subject’s Personal Data
  4. the vital interests of the Subject or some other person would be impacted by not storing / processing their Personal Data
  5. it is in the public’s interest, or required by some appropriate authority
  6. it is to protect the legitimate interests of the Data Controller, save where this is in conflict with the Subject’s rights under GDPR

Data Controllers and Processors are required to put in place processes and technological solutions which protect Personal Data and to declare data storage / processing activities and the legal basis covering these. They must also disclose any breach of regulations within a stipulated period. GDPR applies to any organisation which stores or processes the Personal Data of Subjects within the European Ecconomic Area (EEA); regardless of the domicile of the organisation or the citizenship of the Subject. Thus many non-European organisations are impacted by GDPR and the penalties for non-compliance can be very significant.

Since its inception, many other counties have developed regulations along similar lines to GDPR. Indeed the California Consumer Privacy Act shares much of GDPR’s DNA.

See also: Data Protection.

Genetic Algorithm

A Genetic Algorithm is a technique employed in Optimisation problems (e.g. in Machine Learning). It uses principles similar to those seen in Darwinian Natural Selection. At one iteration, the most successful pairs of solutions are selected from the population (based on some success criteria) and combined randomly (mated one might say). The resulting progeny become the population for the next iteration. The success criteria (fitness in Darwinian terms) ensures that solutions that increase this survive, while ones that don’t face extinction.

Geospatial Data

Geospatial Data is data that has a connection with an explicit location. Examples might include: data that is tagged with latitude and longitude, or data that includes a postal code, or data that references a National grid reference (e.g. Ordnance Survey maps in the UK). Such references obviously allow Data to be plotted on maps or used in other geographic Data Visualisations.

Geospatial Tool

Software explicitly designed to display Geospatial Data, frequently (as might be expected) overlaid on maps, topgraphy and / or satellite imagery.

Graph

See Chart.

Graph Database

Graph Databases consist of networks of nodes and relationships between them (mirroring the concept of a Graph in discrete mathematics, which is somewhat different to an Excel chart). The nodes contain information about entities, e.g. a trading companies, and the relationships capture how nodes are connected in different ways, e.g. supplier / customer. This way of modelling Data is beneficial when complex Data (e.g. all elements of a multi-tiered hierarchy) is to be retrieved en masse.

Graph Databases represent one type of NoSQL Database. An example of a Graph Database is neo4j.

– H – Return to Index
| Submit your own definition | Consider supporting us |
Hadoop

More properly Apache Hadoop. This is the most widely used framework for Big Data and is derived from Google’s initial work in the area. It is an Open Source Data platform with an increasingly rich hinterland of add-on capabilities, e.g. in the areas of Statistical Analysis and Data Visualisation. Hadoop represents one type of NoSQL Database.

See also: Elephants’ Graveyard?

HDFS

Hadoop Distributed File Store. The underpinning storage mechanism of Hadoop, a descendent of Google’s Big Table.

Hierarchical Database

Hierarchical Databases store Data in structures that resemble inverted trees (maybe family trees is a better analogy). These were among the first commercially available Databases, having been developed in the 1960s. Hierarchical Databases have typically been found on large mainframe computers. Although perhaps perceived as legacy software, many companies still operate these Databases which are reliable and highly performant. Issue arise due to the lack of flexibility with which Data can be extracted, something that tends to require specialist programming.

An example of a Hierarchical Database is IBM’s IMS.

Histogram

See Chart.

Hive (HiveQL)

More properly Apache Hive. This is part of the Hadoop suite, which aims to deliver Data Warehouse-like functionality, including Tables and a SQL-like query language, HiveQL.

– I – Return to Index
| Submit your own definition | Consider supporting us |
Image Recognition (Computer Vision)

This sub-discipline of Artificial Intelligence relates to computers and / or software interpreting images, be that fixed ones (like a photograph), moving ones (like a video feed) of even 3D images (like output from a CT Scan). The facial recognition software used for everything from identifying people in a crowd to unlocking your smartphone is one example. When paired with robotics, Image Recognition can help a robot to interact with its environment by understanding it better. For example, tracking a ball in flight and then catching it.

Interpretation requires both Pattern Recognition and the development of a model of what is being looked at. So to state that a photo includes a man and a labrador, there needs to be some concept of living thing –> human –> male adult human and living thing –> dog –> labrador. There is an obvious link to Machine Learning here.

Infographic

Infographic is a portmanteau of Info-[rmation] + Graphic. They are intended to present data or knowledge concisely in and a visual form, which is easily digestible by viewers. While the term can be used broadly to include iconic images such as the London Tube Map, the inexorable rise of Social Media has led to Infographic being frequently applied to a specific sub-form, poster-like images providing the essentials about a subject. Examples of this sub-form may be viewed in The Big Data Universe, How Age was a Critical Factor in Brexit and Scienceogram.org’s Infographic to celebrate the Philae landing.

Information

Information is the first stop in the journey from Data to Information to Insight to Action. Data may be viewed as raw material, which needs to be refined in order to be useful. Information can be thought of as Data enhanced with both relationships and understanding of context. To offer a simple (if possibly also simplistic) example, the fields PID = 201705, BRNID = 12 and TOTSAL = 45766 are Data. The statement “The total sales for the Glasgow Branch in May 2017 amounted to £45,766” is Information; so is the fact that these are up 2% from the previous month and 5% up from the same month in the previous year.

See also: Data and Information.

Information Governance

Data Governance concerns itself with the availability, accuracy, consistency and provenance of Data. This is essentially about facilitating the use of Data and endeavouring to ensure that this leads to good decision-making. Information Governance extends this to consider constraints on the use of Data. These can include Information Security and Data Privacy. Accountability for regulatory and other compliance will generally also fall in this area. Data Governance protects the organisation’s Data and ensures it is fit for use. Information Governance protects the organisation, its customers / business partners and ensures their Data is used in an ethical and legal manner.

Information Security

Information Security consists of the steps that are necessary to make sure that any Data or Information, particularly sensitive Information (trade secrets, financial Information, intellectual property, employee details, customer and supplier details and so on), is protected from unauthorised access or use. Threats to be guarded against would include everything from intentional industrial espionage, to ad hoc hacking, to employees releasing or selling company information. The practice of Information Security also applies to the (nowadays typical) situation where some elements of internal Information is made available via the internet. There is a need here to ensure that only those people who are authenticated to access such Information can do so.

Information Security can also pertain to issues where there is no hostile actor, such as the accidental release of Information to too wide an audience (e.g. a confidential internal mail being sent to external parties by mistake), Information becoming inaccurate over time (perhaps due to some systems no longer being updated with the most recent details), or the loss of sensitive Data through issues with internal systems and infrastructure (e.g. a catastrophic systems failure where insufficient attention has been paid to backup and recovery).

There is a connection with Data Privacy, not least the risk of reputational damage, but the two areas are somewhat different, are approached in different ways and often have different people responsible for them.

See also: The Anatomy of a Data Function – Part III.

In-memory

In a computer, Data is typically stored on some long-term media (a hard disk or solid-state drive), but needs to be brought into short-term memory in order to be accessed by the processing unit. So a cycle might be read two records from disk, load them into memory, change some value on each of them and write back to disk. There are inherent time lags in such arrangements (even with solid-state drives).

With drops in the price of memory chips and the increasing ability of processors and operating systems to address more memory, it has been possible to load significant amounts of Data into memory and keep it there. By eliminating repeated read / write cycles, this allows lightning fast access to Data.

Different types of Databases and tools can run in-memory. Thus there are in-memory Columnar Databases and on-disk Columnar Databases. SAP’s HANA is an example of an In-memory Database.

Internet of Things

A term related to the increasingly vast amounts of Data generated by machines and the linkage of this to the Internet (e.g. Tesla self-driving cars rely upon Data captured by other Tesla cars as well as many other Data sources).

Insight

Insight is the second stopping point on the journey from Data to Action, though (as per my model) a short-cut from Data to Insight may be taken sometimes. If Data might consist of the fields PID = 201705, BRNID = 12 and TOTSAL = 45766 and Information mighty be conveyed by the statement that “The total sales for the Glasgow Branch in May 2017 amounted to £45,766”, then Insight might be that increase in sales has been strongest in the 18-25 age bracket where buyers have a strong interest in personal health and fitness.

More broadly – and like Analytics – while Information is generally about answering questions around the reasons why Data was captured in the first place, Insight is more to do with teasing out other perspectives from the same Data, or maybe via combining this with other data, e.g. geographic data, demographic data and so on.

– K – Return to Index
| Submit your own definition | Consider supporting us |
Key Performance Indicator (KPI)

Those measurements of performance that are most crucial to the understanding and monitoring the performance of a whole organisation or of parts of it. The “K” is important, measurements that are merely interesting or of some use are Performance Indicators (PIs), not KPIs; though a Divisional or Country KPI may be just a PI at Group or Head Office level. Ideally the number of KPIs should be kept relatively small to aid monitoring and also communication about why they are important. KPIs often form the basis of Dashboards.

KPI

See: Key Performance Indicator.

– L – Return to Index
| Submit your own definition | Consider supporting us |
Line Chart

See Chart.

Linear Regression

See Model.

Logistic Regression

See Model.

– M – Return to Index
| Submit your own definition | Consider supporting us |
Machine Learning

An Artificial Intelligence technique, which employs large Data sets (thus the link to Big Data) to “train” Algorithms to recognise patterns and draw inferences. An example would be interpreting what is going on in a photo, e.g. “a boy is throwing a red ball”. Algorithms tuned by Machine Learning already routinely achieve super-human abilities, albeit in narrow contexts, such as face recognition. Generalised Machine Learning (where the code can adapt to learning many different things), like Generalised AI (effectively the creation of conscious AI entities), is some way off. Machine Learning typically leverages an area of mathematics call Linear Algebra.

Machine Learning
© Randall Munroe of xkcd.com

See also: A Nobel Laureate’s views on creating Meaning from Data and the addendum.

Management Information (MI)

Management Information is a term applied to any facts and figures gathered to support business decision-making. This is a broad term and could cover many different types of facts and figures. However nowadays, MI is often taken to mean more traditional facts and figures, ones that appear on Reports or Dashboards and which are essentially created by adding up figures. Examples would include: various types of reports Financial reports, Sales reports, Workflow reports and so on.

Today, though the distinctions are often blurred, MI is generally seen as describing what has happened in an organisation (were sales up or down last quarter) as opposed to explaining why (customer segment X saw a steep fall off in conversions, which can be described as Analysis) or predicting what might happen next (e.g. forecasting next quarter’s sales, which tends to be something that is done by Analytics).

Map Chart

See Chart.

MapReduce

Google’s original process (now leveraged in Hadoop and elsewhere) for breaking a task into component parts, running each of these (together these comprise the Map element) and combining the results (the Reduce element). Comparable to Massively Parallel Processing. Google has since moved on to more advanced processes for its Big Data work.

Materialised View

See View.

Massively Parallel Processing (MPP)

A technique (and hardware embodying this) which splits a task into segments, each of which is carried out by a single processing unit, with the process being coordinated and results consolidated by controlling software.

Master Data

Master Data can perhaps be best described as reference Data, though other epithets are often applied, such as lookup Data (which probably makes most sense to those with an Excel background) standing Data and standard Data. Some Data will tell you about dynamic things, such as the product prices associated with a sale; here price could take a very wide range of values. By way of contrast, Master Data tells you about the more permanent things that the sale is associated with. These might include the office and salesperson, the type of product sold, the customer, and so on. Each of these will have a much smaller range of possible values than our example of price and it is generally important that correct values are assigned.

Taking a more accountancy-centric view, a General Ledger journal will have an amount (which is again very variable) and often a cost centre and account, both of which will fall into relatively small sets of possible values.

Despite changing much less frequently, Master Data is not immutable. The details of customers may actually be quite volatile for example, the attributes of offices much less so. This leads to a need for approaches to controlling this area and the field of Master Data Management.

Contributor: Scott Taylor

Master data is a single source of common business data used across multiple systems, applications, and/or processes.

See also: Scott’s contribution to the Wikipedia entry.

Master Data Management (MDM)

Master Data Management is the term used to both describe the set of process by which Master Data is created, changed and deleted in an organisation and also the technological tools that can facilitate these processes. There is a strong relation here to Data Governance, an area which also encompasses broader objectives. The aim of MDM is to ensure that the creation of business transactions results in valid Data, which can then be leveraged confidently to create Information.

Many of the difficulties in MDM arise from items of Master Data that can change over time; for example when one counterparty is acquired by another, or an organisational structure is changed (maybe creating new departments and consolidating old ones). The challenges here include, how to report historical transactions that are tagged with Master Data that has now changed.

See also: The Anatomy of a Data Function – Part II

MDM

See: Master Data Management.

Measure

See Multidimensional Approach.

Metadata

Data about Data. So descriptions of what appears in fields, how these relate to other fields and what concepts bigger constructs like Tables embody. This helps people unfamiliar with a Dataset to understand how it hangs together and is good practice in the same way that documentation of any other type of code is good practice. Metadata can be used to support some elements of Data Discovery by less technical people. It is also invaluable when there is a need for Data Migration.

See also: The Anatomy of a Data Function – Part II

MI

See: Management Information.

Model (Statistical Model)

A mathematical representation of some physical process (e.g. the mortality and morbidity of a population with certain attributes). Some Models may have no statistical element, e.g. cash-flow models in Finance. However many models use statistical methods to derive approximations of future events based on past events, or to better understand the underlying mechanics of past events.

This dictionary could easily double in length if I included many of the statistical terms associated with modelling. Instead here are some selected mini-definitions, including some relevant to Machine Learning:

Boosting

This is a technique employed in Machine Learning where a series of models that are only mildly explicative (weak learners in the parlance) are combined (often with some weighting) in order to produce a more explicative model (a strong learner).

Clustering

An iterative method of dividing a population into groups in such a way that the members of each group share more with each other than the members of any other group. This approach is often used in segmenting customers by particular attributes or baskets of attributes (e.g. demographics, behavioural attitude etc.).

Linear Regression

If Data consists of pairs such as input value and output value. Then it can be plotted on respectively the x (input) and y (output) axis of a graph. In simple terms, linear regression is equivalent to drawing a line of best fit on the resulting x-y graph. The line which has best fit minimises the distance from all of the plotted points and balances divides the points into roughly equal populations.

This approach can scale up to more than one input value, so long as there remains a single output value; so x axis (input 1), y axis (input 2), z axis (output).

Logistic Regression

A form of regression where there are again (perhaps multiple) input values and one output value, but the output can take only discrete values (e.g. pass or fail, vote for one of candidate A, B or C), rather than continuous ones.

Multivariate Analysis

This covers the case where there is more than one output value – i.e. more than one variable, hence multivariate.

Random Forest

A Machine Learning technique where a large number of Decision Trees are generated and run, with the output being the average of these. Decision Trees can suffer from Overfitting to their Training Data and a Random Forest addresses this deficiency.

Sensitivity Analysis

Determining how variability in the output of a model is related to variability in its inputs. For example, how a change in product price might impact profitability (less sales pushing in one direction, more value per sale pushing in the other).

Time Series Analysis

A Time Series is a set of Data which can be ordered according to time; e.g. sales per day, closing stock price per day, average temperature by month and so on. Time Series Analysis is the process of discerning trends and patterns in this type of Data, normally with the objective of making predictions for how the Data will behave in the future. The term can cover anything from drawing a simple line chart with time as one axis to using a mathematical technique called Fourier Analysis to generate the spectrum of a Time Series which possesses some cyclical element (e.g. seasonality).

See also: Keynote Articles Section 9.

MPP

See: Massively Parallel Processing.

Multi-dimensional Approach

A Multidimensional Database is one which is structured in a way that most directly supports the related concept of On-line Analytical Processing (or OLAP). The multidimensional approach concentrates transactional Data (or sometimes this aggregated into balances) into a single Table called a Fact Table, which contains all pertinent Measures for an area of analysis together with links to relevant Dimensions (see below for definitions of these terms). Creating a Multidimensional Database from source Data that is structured differently is the province of Extract Transform and Load tools. Once built Information may be retrieved very quickly and users may flexibly manipulate and filter the Data in a way that makes sense to them. By way of very direct analogy, it may take quite some time to construct all of the Data that goes into an Excel pivot table, but then the pivot table can be used in a number of different ways.

A selected set of definitions relating to the Multidimensional Approach appear below:

Dimension

Elements that you want to analyse Data by. So country, branch, product and so on. Dimensions are sometimes arranged into hierarchies so Region, Country, Region, Town or Year, Month, Day.

Measure

Numeric quantities that you want to analyse. For example, counts like number of sales orders or number of customers; monetary values like sales revenue or costs; or percentages such as growth or profit margin.

Fact Table

For a particular multidimensional structure, all relevant Measures will be gathered into a central table called a Fact Table. The same Fact Table will let you look up any Measure or combination of Measures or allow you to aggregate these.

Star Schema

An arrangement where a central Fact Table is surrounded by a number of Dimension Tables allowing the Measures in the Fact Table to be “sliced and diced” by the Dimensions. For example, new customers and value of orders they have placed by country and product type.

Cube

Multidimensional Databases are often referred to as Cubes, particularly where they are saved using proprietary technology (such as Microsoft SQL Server Analysis Services).

Multivariate Analysis

See Model.

– N – Return to Index
| Submit your own definition | Consider supporting us |
Natural Language Processing (NLP)

An area of Artificial Intelligence research that is also a subset of Linguistics. It focusses on two main topics. First, developing software that can parse human speech or writing (see Text Analytics) in order to form an understanding of the meaning it conveys. Second, the same software generating credible and pertinent responses to such input. Nirvana for NLP would be a software agent that was indistinguishable from a human in conversation (also known as passing the Turing Test).

Neural Network

See Deep Learning.

NLP

See: Natural Language Processing.

NoSQL

Databases that are designed to store and retrieve very large volumes of Data and – as a result – do not use the more general SQL query language to read and write Data but instead their own specialist approaches. The various tools used in a Big Data implementation are examples of NoSQL.

– O – Return to Index
| Submit your own definition | Consider supporting us |
ODS

See: Operational Data Store.

OLAP

See: On-line Analytical Processing.

OLTP

See: On-line Transaction Processing.

On-line Analytical Processing (OLAP)

A rather clumsy term that arose out of On-line Transaction Processing, the latter being is what most systems support. OLAP describes structuring Data in a manner which facilitates analysis. This consists of defining Dimensions (the things we want to view Information by, such as Product, Month, Customer etc.) and Measures (the numbers we want to view, such as Sales, Returns, EBITDA etc.). This drives the Multidimensional Approach, which also underpins the design of Data Warehouses.

On-line Transaction Processing (OLTP)

On-line Transaction Processing is a term applied to what most people would view as the central purpose of IT systems; i.e. recording business transactions. Most commercially available software systems fall into the OLTP category. OLTP Databases are optimised for entering Data, not for querying it, something that leads to the alternative On-line Analytical Processing paradigm.

Operational Data Store (ODS)

A structure, generally part of an overall Data Warehouse architecture, that holds all unaggregated Data from source systems. This Data would be transformed (by ETL) to be self-consistent and may also have elements of a Multidimensional Approach applied to it. However it would differ from the main Data Warehouse structures by a) not being aggregated, b) being updated more frequently, or close to real-time and c) often maintaining less history. Its ODS is often the main source from which a Data Warehouse is built. An ODS can be used both to support operational reporting, which tends to be more detailed, and as a mechanism to provide granular Data to other applications that need it, e.g. Digital front-ends.

Operational Repository

A Data Repository which forms a major part of a modern Data Architecture and is focussed on supporting the generation of Information (cf. an Analytical Repository, which is focussed on supporting the generation of Insight). An Operational Repository will hold internal Transactional data relating to an organisation’s core operations, sometimes also also in summary form to better support Analysis.

The volume of data will typically be much lower than for an Analytical Repository and its contents will be subject to many more Data Controls and be highly reconciled. One major purpose of an Operational Repository is to provide the data needed by Financial Systems (e.g. General Ledgers etc.) in a robust and efficient manner. Another is to support the vast majority of Management Information (both Reports and Dashboards) used by the organisation. Operational Repositories are more likely to employ more traditional data technologies such as Relational Databases, which may not be the case with their Analytical counterparts. In many organisations an Operational Repository would be synonymous with a combination of a Data Warehouse and an Operational Data Store (it being a broader term than either).

See also: A Simple Data Capability Framework

Optimisation

Optimisation refers to a process for selecting the best (optimum) outcome from a set of possible alternatives. Such processes tend to be iterative in nature with a best outcome emerging after a number of cycles (possibly limited, i.e. select the best result after 100 cycles). Optimisation is the province of an area of Mathematics and Computer Science called Optimisation Theory. Specifically Machine Learning approaches will employ algorithms, such as Stochastic Gradient Descent (SGD) or Coordinate Descent, to drive Optimisation processes.

Outlier Detection

See Anomaly Detection.

Overfitting

A problem in Statistics and Machine Learning where a Model matches the data used to create it so well that it loses explicative power when presented with further related data sets. Most models aim to separate Signal from Noise, overfitting normally occurs where this has been unsuccessful and the Model is instead explaining Noise specific to the initial data set.

– P – Return to Index
| Submit your own definition | Consider supporting us |
Pattern Recognition

This is a broad term covering activities in areas such as neuroscience; but here the focus is on the recognition of patterns in data. This could be identifying potentially suspicious bank transactions, teasing out meaning from the petabytes generated by a Large Hadron Collider experiment, finding edges in a photograph, or working out which people a COVID-19 sufferer has come into contact with in the last month. Often a phenomenon is broken into constituent parts and patterns are examined in each, before the pieces are reconstituted. There are clearly linkages between Pattern Recognition and both Machine Learning and Image Recognition.

Personal Data

Personal Data both has an obvious general meaning and a more technical one under GDPR, but the meanings are not mutually inconsistent. To take the more precise definition, Personal Data is data which relates to a specific, identified person, or which may allow a specific person to be identified. So while obviously things like full name, full postal address and Governament-issued ID numbers (e.g. Passport Number, Social Security Number in the US, National Insurance Number or NHS Number in the UK) are Personal Data, so might be a combination of location and demographic data if this uniquely identifies a single person (or indeed a small group of people). In a hypothetical situation, there might be only one male of Uzbek ethnicity in Fordwich, Kent (population 381).

The GDPR definition of Personal Data is principles-based, whereas those pertaining in other parts of the world (for US HIPPA regulations that govern medical data) can be more rules-based. GDPR and many somewhat simmilar regulations worldwide cover how Personal Data can be stored and used and the various legal bases for this.

See also: Personally Identifiable Information (PII).

Personally Identifiable Information (PII)

Personally Identifiable Information is a US term which is often used synonymously with Personal Data. However, the term covers four distinct meanings under US law, none of which is precisely the same as the meaning of Personal Data under GDPR. Given, the potential confusion, the term is not widely used outside of the US.

See also Personal Data.

Pie Chart

See Chart.

PII

See Personally Identifiable Information.

Pig

A language used for creating MapReduce (or Spark) routines in more of a high-level language. The term “Pig” comes from Pig Latin. A Pig script might load a file, label the columns it contains, filter it by the contents of one or more of these and write the resulting Data into a new file. An example of its usage might be some code to determine how many occurrences of a particular word there are in a given set of files. Pig has some elements in common with SQL, but does not attempt to be SQL-like the way that HiveQL does.

Pseudonymisation

Pseudonymisation is one approach to ensuring the Protection of Personal Data. The term drives from “pseudonym”, which means “false name” in Greek.

An Operational System will need to have things like customer name, address and contact details stored in it (though obviously in a secure manner) in order to do things like despatching goods accurately, or handling complaints. Such usage has a legal basis under GDPR and is typically consented to by the customer.

However, an Analytical System would not necessarily be covered by the same legal basis / customer consent. In order for the Analytical System to be able to use the records from the Operational System, the personal data must be somehow protected.

A simplistic explanation of pseudonymisation would be that references to “Freddy” in Operational System records are replaced with references to “Mr Orange” in Analytical System records instead. As opposed to just blanking out “Freddy”, under this approach, we might be able to retain some non- (or perhaps less) personal data about the now more mysterious Mr Orange; data that is useful for analysis, but does not breach GDPR. So we might be able to include the facts such as: Mr Orange is male, Mr Orange is white (not White), Mr Orange lives in Los Angeles, Mr Orange is 30 – 40 years old. None of these uniquely define Mr Orange or allow us to unmask him. It would not be possible to record sensitive details, such as “Mr Orange is an undercover policeman”, or to hold his home address. The master table with entry “Freddy = Mr Orange” in it is kept under lock and key and not made available to Data Scientists.

This approach allows richer analysis. However there have to be some safeguards. For example certain elements of demographic information, when combined with other analytical attributes, might inadvertently lead to Mr Orange being unmasked. For example, it is not impossible that someone is the only person in a post code who identifies as of non-binary gender, is of South East Asian ethnicity and in the 65 – 75 age group. In some circumstances, a person might be identified even when pseudonymisation is employed. There are various technical ways round this, which basically centre on further obfuscating any records where there are less than some threshold of people sharing a set of attributes.

Pseudonymisation also allows you to retrieve the personal data in exceptional circumstances. One legal basis for the use of personal data is if this is “to protect the vital interests of a data subject or another individual”. If there was a potential threat to a person’s well-being, then it could be to their advantage that they are contacted and informed of this. Typically such a process would be handled by a Data Privacy Office, rather than an Analytical function, in order to ensure a compliant approach.

See also: Anonymisation

Python

A Open Source programming language that is often the tool of choice for Data Scientists manipulating large Data sets. Some reasons for this include its ease of use and its extensive libraries of statistical capabilities.

– R – Return to Index
| Submit your own definition | Consider supporting us |
R

A powerful Open Source statistical programming language, often employed on top of a Big Data solution, but also on more traditional Relational Databases and other Data sources.

Radar Chart [Spider Chart]

See Chart.

Random Forest

See Model.

Reference Data

Contributor: George Firican

A set of permissible values (such as “France”, “Belgium” and “The Netherlands”) associated with a distinct definition (e.g. Country), used within a system or shared between multiple systems in an organization, domain or industry, which provides standardized language to further categorise a Data record.

See also: Master Data.

Referential Integrity

A concept within Relational Databases, which consist of Tables with Columns and relationships between the contents of these. For example a table may record a customer’s contact details, including Country. A list of valid Countries and the codes associated the them will be stored in another, look-up, or reference, Table (sometimes referred to as Master Data). An example of Referential Integrity would be that only Country codes that are defined in the look-up, or reference, Table should appear on the Customer details table. Such Referential Integrity may be enforced in a number of ways. If, for example, an application (e.g. a Sales System) sits above the Database, then the code of this system may ensure Referential Integrity. Also, many Databases have features (e.g. explicit constraints, or triggers containing validation code executed when a record is created or updated) that allow Referential Integrity to be implemented. It is a challenge to maintain Referential Integrity through events such as: a manual fix to some error in the Database, a Database or application update, transferring Data to a reporting or analytics Database. There is also the issue that Reference Data can change over time, e.g. Czechoslovakia became the Czech Republic and Slovakia.

Relational Database

A Database that stores Data in Tables with relations between them. E.g. There may be a Customer table with contact details and marketing preferences and a Sales table linked to this with products, price and purchase dates. Relational Databases have their contents created, modified and read using the industry standard SQL language. Relational Databases have been the de facto standard for supporting all IT systems in the last 40 years. They remain the standard for transactional systems (web-sites, sales systems, General Ledgers) and for statutory, regulatory and publicly available Information. Since the mid-2000s they have been challenged in the Insight and Analyticsspace by Big Data solutions.

The acronym RDBMS stands for Relational Database Management System and is close to synonymous with Relational Database. Examples of Relational Databases include Oracle and Microsoft’s SQL Server.

Report

As may be determined from the name, the genesis of Reports were documents prepared to inform a superior of what was going on; think of reports of “progress” at the front being relayed to World War I generals by their subordinates. In a business context such updates to management inevitably contained figures as well as commentary. With the advent of electronic computers, it became possible to produce the figures bit of reports automatically and this became somewhat decoupled from the explanatory commentary, with the former retaining the term Report. In early years (and even 2019) many Reports would have been produced on paper (often paper with sprocket holes). As visual display units became more common and of a higher specification, Reports became something that could be consumed on a screen (or SmartPhone), but many acres of woodland still go into printing them.

A typical report will consist of columns of text and data, perhaps summarised and normally with sub-totals appearing at regular points. While there is no hard and fast rule, Reports tend to be descriptive of what has happened in an organisation rather than explicative (which is often the preserve of humans) or predictive (which is often the preserve of Analytics).

Robot (Robotics, Bot)

A Robot is a machine which is capable of acting independently to carry out one or more task. Robots are typically controlled by some form of computer and / or software. Robotics is the study of how to create such machines and their control mechanisms; as such it is a combination of engineering and computer science, with strong linkages to Artificial Intelligence and Image Recognition.

Some Robots may have no physical manifestation and instead operate purely digitally as software agents, these are called Software Robots, Software Bots, or just Bots.

Robotic Process Automation (RPA)

Robotic Process Automation is a method for automating business processes that obviates the need to describe these processes in full detail. In normal process automation, a developer will have to model the activity to be automated in code (or more likely some sort of pseudo-code if using an automation tool) and make calls to APIs to process the relevant transactions. With RPA, Machine Learning techniques are initially used to “observe” users completing tasks (e.g. entering data into an application or web-page) and determine how to do the same. The software agent can then carry out these tasks themselves, mimicking fingertip input rather than calling an API. Some RPA agents can also learn how to complete related tasks not covered by the initial Training phase.

Thus RPA replaces the human interaction element with a “robot” doing the same indirect work, emulating what the human would do. By way of contrast, traditional process automation replaces the human interaction element with code enabling applications talk directly to each other via APIs and involves no human emulation.

Robotics

See: Robot.

Some Robots may have no physical manifestation and instead operate purely digitally as software agents, these are called Software Robots, Software Bots, or just Bots.

RPA

See: Robotic Process Automation.

– S – Return to Index
| Submit your own definition | Consider supporting us |
SAR

See Subject Access Request.

Scatter Chart

See Chart.

Self-service [BI or Analytics]

Self-service in either BI or Analytics has precisely the same meaning as in a restaurant, patrons wander up to a food bar with their plates and put whatever they like on them. Self-service has become the objective of many data-centric projects and programmes, ostensibly putting the needs of “customers” of data at the centre of work. However there is an alternative interpretation, that the projects and programmes have given up trying to provide data sets that meet people’s needs as it is too hard. Instead they provide access to data and say “it’s now your problem to do stuff with it”. Maybe the truth lies somewhere between these extremes. However it is undeniable that the success or failure of a Data Lake is inextricably linked to how well it is Curated and that of a Data Warehouse is similarly correlated to the fidelity with which its Data Model reflects business needs. Self-service is a good tool to have the in bag when looking to deliver a complete data solution, but it is unwise to have it be the only tool in the bag.

Sensitivity Analysis

See Model.

Sentiment Analysis

This has the objective of understanding the state of mind of individuals, often customers, or potential customers, and how this might impinge on their relationship with an organisation. For example, do they have a positive view of the organisation’s brand? Did they react positively or negatively to a recent news story about the organisation. This discipline often uses Social Media sources as a primary input, though survey feedback and comments made to customer service representatives may also feature. Sentiment Analysis draws on elements of both Text Analytics and Natural Language Processing. Objectives might include determining which product or service to offer on a web-page or in advertising, or forestalling a good customer leaving for a competitor because of some shift in their opinion about the organisation.

Single Customer View

The concept of a Single View of the Truth more narrowly applied to just customer Data. Historically this has been achieved via Customer Relationship Management systems, but other Data repositories such as Data Lakes and Data Warehouses have sometimes played this role.

An Analytical SCV is one which is complete and accurate enough to support meaningful statistical analysis. An Operational SCV is one which is complete and accurate enough to support individual customer interactions, be this by ‘phone, e-mail or voice or via Digital media such as web-sites and smart ‘phones.

Single Version of the Truth

Generally an aspirational state where all decision making in an organisation relies upon the same source of Data, normally a central repository of some sort such as a Data Lake (more accurately the models that Data Scientists build on this) or Data Warehouse. SVT is different to all numbers used in an organisation being identical. For example a monthly sales report might treat new business in a different way to a Finance report. The important point is that both figures ought to originate from the same place, even of they are treated differently later (e.g. cut-off dates being different for different purposes).

See also: A single version of the truth?

Software Bot

See: Robot.

Spark

More properly Apache Spark. Spark was developed to improve upon the speed of the MapReduce approach where the same Data is accessed many times, as can happen in some queries and algorithms. This is achieved in part by holding some or all of the Data to be accessed In-memory. Spark works with HDFS and also other distributed file systems, such as Apache Cassandra.

See also: Elephants’ Graveyard?

SQL

Short for Structured [English] Query Language. A standardised language for asking questions from Relational Databases. SQL has been the standard for interacting with Databases for the last four decades.

Star Schema

See Multidimensional Approach.

Statistics

Statistics is the branch of Mathematics concerned with the aggregate properties of large (sometimes infinite) sets of Data, often termed populations. Statistics focuses on how data is collected, Analysed and interpreted. Examples of the aggregate properties of data (descriptive statistics) include ones that measure where the centre of a distribution of data lies such as mean, mode and median together with ones that focus on how much it is spread out such as variance, standard deviation and kurtosis.

Statistics can describe the compilation of tables of data, the Graphing of data or the development of Models.

Statistical Model

See Model.

Structured Data

A high proportion of the Data captured by most organisations. Anything than can be captured in a Table with rows and columns (and thus reproduced in Excel).

Structured Reporting Framework

As described in the entry for Data Governance Framework, a framework is a structure within which you place things in order that they form a coherent part of an overall whole. A Structured Reporting Framework is way of organising various Information and Insight elements, such as Reports, Dashboards and Analysis Facilities, into a coherent whole.

The characteristics of a Structured Reporting Framework include all its elements being underpinned by the same consistent data sources with identical terminology and calculations employed. Also – if within access controls – users should be able to move in any direction around the framework. A CEO might start with a very high-level Dashboard summarising the health of the organisation, notice something, drill into the details, perhaps moving to a divisional or support function dashboard, then maybe into a Cube or Report. Importantly the Reports accessed by the CEO would be the same ones used by more junior staff in their day-to-day activities; this aids communication and mutual understanding. Symmetrically, an Operations person could see how their work contributes to the business results of their part of the organisation and compare what is happening locally with, for example, counterparts in other locations. All of this is accomplished within the Structured Reporting Framework. When the back-end elements of a Data Architecture are designed properly and with sufficient business input, a Structured Reporting Framework should be a natural by-product of this work.

See also: This Structure has Novel Features which are of Considerable Business Interest

Subject

Under GDPR, a Subject is defined as an “identified or identifiable natural person”. Less legalistically, this means a specific human being, whose data is stored by an organisation (a Data Controller or Data Processor).

Subject Access Request (SAR)

Under GDPR, individuals have a right to find out if an organisation is storing their data and how it is being stored. This extends to requesting a copy of the data from the organisation. Such requests are known as Subject Access Requests, where the Subject refers to the individual whose data may be held.

System of Record

A system which captures transactions material to the Statutory Financial results or Regulatory submissions of an organisation. A System of Record will be the definitive source of Data about transactions.

– T – Return to Index
| Submit your own definition | Consider supporting us |
Table

The fundamental component of many Databases. Used to store specific sets of Data, generally to do with a single area, e.g. a customer address table. A Database will generally contain many tables. In a Relational Database, each table is in turn made up of columns and rows in a way that is analogous to an Excel spreadsheet. Each column holds a different type of Data element (e.g. Column 1 = First Name, Column 2 = Second Name, Column 3 = Date of Birth), whereas each row gathers together one set of values for each of the columns (e.g. Row 1 = “Bill”, “Gates”, “28-OCT-1955”, … and Row 2 = “Elon”, “Musk”, “28-JUN-1971”, …).

Note: HDFS does not have the concept of a table (the FS stands for File Store) but rather files, which can be stored in variety of formats, the simplest being plain text. Other parts of the Hadoop suite, e.g. Hive, do support structures analogous to tables.

Testing Data (Training Data)

In Machine Learning, the “machine”, typically embodying a Neural Network either physically or in software, is initially fed a lot of historical Data, for example photographs which either contain or do not contain some object. Based on this, the “machine” develops its own rules which allow it to determine the presence of, say, a red ball. The Data used to achieve this is called Training Data. Once these rules have been developed, they are tested against a separate set of Data that has been held back during training, the objective being to assess the efficacy of the “machine’s” rules. This second set of Data is Testing Data.

The process is somewhat analogous to that which I presented in Using historical Data to justify BI investments – Part II. Here I used two sets of historical Data 2006 – 2008 and 2009 – 2010, the first played the role of the Training Data, the second that of the Testing Data. The 2006 – 2008 Data was used to create a rule which would predict 2009 – 2010 performance (without accessing the 2009 – 2010 Data in any way). This could then be compared to the real 2009 – 2010 Data to check efficacy and – if necessary – recalibrate. While the details are different and human judgement (mine) was applied in the rule creation, the spirit of this process is not a million miles from Machine Learning.

Text Analytics (Text Mining)

The process of parsing text to derive meaning and identify patterns. This could be based on context provided alongside text (semantics) or working on raw text alone. Text Analytics may employ techniques drawn from Machine Learning and – for obvious reasons – Natural Language Processing. One objective of Text Analytics may be Sentiment Analysis.

See also: Literary calculus?

Text Mining

See: Text Analytics.

Time Series Analysis

See Model.

Training Data

See Testing Data.

Transactional System

Related to Systems of Record. A system into which transactions (e.g. new purchase orders, updates to existing purchase orders, returns etc.) are entered by humans, created from Data interfaced from other systems, generated on web-sites, or sent from sensors. The main attribute of a transactional system is that historical transactions are not changed, but instead modified by new transactions. This allows historical positions to be recreated.

Tree Map

See Chart.

– U – Return to Index
| Submit your own definition | Consider supporting us |
Unstructured Data

Natural language text, video, photographs / other images, telephony capture, social media / web-site interactions, some aspects of the Internet of Things etc.

– V – Return to Index
| Submit your own definition | Consider supporting us |
View (Materialised View)

A construct in a Relational Database that is analogous to a virtual Table. When someone queries a table, this actually executes a piece of SQL, which could reference several tables at once. This means that a person interacting with a View can have some complexities of the source Data hidden from them. A View might be used to combine Data from two dissimilar tables, making them seem as one. It might allow access to only a subset of the contents of a table (certain columns and/or certain rows for example) according to security requirements or just the needs of a user. It might supplement raw Data by including calculations (Field A × Field B) or adding looked-up descriptions from another table.

In some Relational Databases, instead of being virtual, the output of a View’s SQL is saved to speed access; this is known as a Materialised View.

– W – Return to Index
| Submit your own definition | Consider supporting us |
Web Analytics

Web Analytics is a capability, to monitor how people interact with an organisation’s web-sites and mobile applications. This would include how they found a site / app (e.g. a search engine, an advert placed on another web-site, or a link from another web-site, perhaps an affiliate marketer), what they do while on a site or in an app (what links they clicked on, if relevant what products or services they bought, how much time they spent on each part of a site / app, whether they had any problems such as broken links etc.) and whether they register for any further information / contact (e.g. asking for a quote or for someone to call them, registering for a newsletter, asking a question etc.).

A primary objective of Web Analytics is to ensure that web-sites and apps are optimised to give the best user experience. However other aims can be to test the efficacy of marketing campaigns (do they result in more hits and do more hits lead to more purchases?), to more broadly understand customer behaviour and needs (if you bought this product, you might also be interested in this other one) and sometimes to attempt to identify additional information about visitors (e.g. via IP Geolocation, or through a visitor’s Social Media accounts if shared with the site).

Web Analytics teams tend to live in either Marketing or Digital departments.
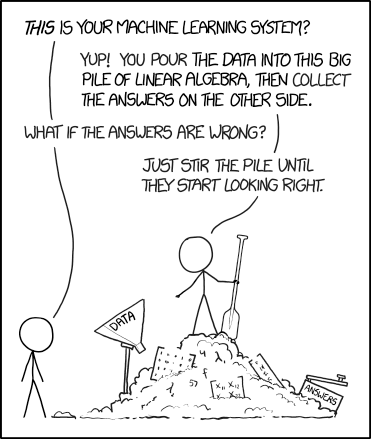
See also: Clickstream Analysis

Consider Supporting The Data & Analytics Dictionary

Like all of the content on peterjamesthomas.com, The Data & Analytics Dictionary is free. However, it does take time and effort to write. If you have found The Dirctionary useful or informative, you might consider helping to maintain and extend it by making a small contribution to defray our costs. Pay as much or as little as you want. Of course this is entirely optional.


Acknowledgements

I owe thank yous to the following, in chronological order:


Text & Images: © Peter James Thomas 2017-20.
Published under a Creative Commons Attribution 4.0 International License.