A Nobel Laureate’s views on creating Meaning from Data

Image © MRC Laboratory of Molecular Biology, Cambridge, UK

Praise for the Praiseworthy

Today the recipients of the 2017 Nobel Prize for Chemistry were announced [1]. I was delighted to learn that one of the three new Laureates was Richard Henderson, former Director of the UK Medical Research Council’s Laboratory of Molecular Biology in Cambridge; an institute universally known as the LMB. Richard becomes the fifteenth Nobel Prize winner who worked at the LMB. The fourteenth was Venkatraman Ramakrishnan in 2009. Venki was joint Head of Structural Studies at the LMB, prior to becoming President of the Royal Society [2].

MRC Laboratory of Molecular Biology

I have mentioned the LMB in these pages before [3]. In my earlier article, which focussed on Data Visualisation in science, I also provided a potted history of X-ray crystallography, which included the following paragraph:

Today, X-ray crystallography is one of many tools available to the structural biologist with other approaches including Nuclear Magnetic Resonance Spectroscopy, Electron Microscopy and a range of biophysical techniques.

I have highlighted the term Electron Microscopy above and it was for his immense contributions to the field of Cryo-electron Microscopy (Cryo-EM) that Richard was awarded his Nobel Prize; more on this shortly.

First of all some disclosure. The LMB is also my wife’s alma mater, she received her PhD for work she did there between 2010 and 2014. Richard was one of two people who examined her as she defended her thesis [4]. As Venki initially interviewed her for the role, the bookends of my wife’s time at the LMB were formed by two Nobel laureates; an notable symmetry.

2017 Nobel Prize

The press release about Richard’s Nobel Prize includes the following text:

The Nobel Prize in Chemistry 2017 is awarded to Jacques Dubochet, Joachim Frank and Richard Henderson for the development of cryo-electron microscopy, which both simplifies and improves the imaging of biomolecules. This method has moved biochemistry into a new era.

[…]

Electron microscopes were long believed to only be suitable for imaging dead matter, because the powerful electron beam destroys biological material. But in 1990, Richard Henderson succeeded in using an electron microscope to generate a three-dimensional image of a protein at atomic resolution. This breakthrough proved the technology’s potential.

Electron microscopes [5] work by passing a beam of electrons through a thin film of the substance being studied. The electrons interact with the constituents of the sample and go on to form an image which captures information about these interactions (nowadays mostly on an electronic detector of some sort). Because the wavelength of electrons [6] is so much shorter than light [7], much finer detail can be obtained using electron microscopy than with light microscopy. Indeed electron microscopes can be used to “see” structures at the atomic scale. Of course it is not quite as simple as printing out the image snapped by you SmartPhone. The data obtained from electron microscopy needs to be interpreted by software; again we will come back to this point later.

Cryo-EM refers to how the sample being examined is treated prior to (and during) microscopy. Here a water-suspended sample of the substance is frozen (to put it mildly) in liquid ethane to temperatures around -183 °C and maintained at that temperature during the scanning procedure. The idea here is to protect the sample from the damaging effects of the cathode rays [8] it is subjected to during microscopy.
 
 
A Matter of Interpretation

On occasion, I write articles which are entirely scientific or mathematical in nature, but more frequently I bring observations from these fields back into my own domain, that of data, information and insight. This piece will follow the more typical course. To do this, I will rely upon a perspective that Richard Henderson wrote for the Proceedings of the National Academy of Science back in 2013 [9].

Here we come back to the interpretation of Cryo-EM data in order to form an image. In the article, Richard refers to:

[Some researchers] who simply record images, follow an established (or sometimes a novel or inventive [10]) protocol for 3D map calculation, and then boldly interpret and publish their map without any further checks or attempts to validate the result. Ten years ago, when the field was in its infancy, referees would simply have to accept the research results reported in manuscripts at face value. The researchers had recorded images, carried out iterative computer processing, and obtained a map that converged, but had no way of knowing whether it had converged to the true structure or some complete artifact. There were no validation tests, only an instinct about whether a particular map described in the publication looked right or wrong.

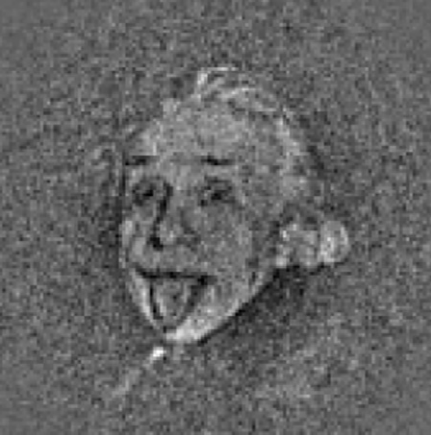
The title of Richard’s piece includes the phrase “Einstein from noise”. This refers to an article published in the Journal of Structural Biology in 2009 [11]. Here the authors provided pure white noise (i.e. a random set of black and white points) as the input to an Algorithm which is intended to produce EM maps and – after thousands of iterations – ended up with the following iconic mage:

Reprinted from the Journal of Structural Biology, Vol. 166. © Elsevier. Used under licence 4201981508561. Copyright Clearance Center.

Richard lists occurrences of meaning being erroneously drawn from EM data from his own experience of reviewing draft journal articles and cautions scientists to hold themselves to the highest standards in this area, laying out meticulous guidelines for how the creation of EM images should be approached, checked and rechecked.

The obvious correlation here is to areas of Data Science such as Machine Learning. Here again algorithms are applied iteratively to data sets with the objective of discerning meaning. Here too conscious or unconscious bias on behalf of the people involved can lead to the business equivalent of Einstein ex machina. It is instructive to see the level of rigour which a Nobel Laureate views as appropriate in an area such as the algorithmic processing of data. Constantly questioning your results and validating that what emerges makes sense and is defensible is just one part of what can lead to gaining a Nobel Prize [12]. The opposite approach will invariably lead to disappointment in either academia or in business.

Having introduced a strong cautionary note, I’d like to end this article with a much more positive tone by extending my warm congratulations to Richard both for his well-deserved achievement, but more importantly for his unwavering commitment to rolling back the bounds of human knowledge.
 
 
If you are interested in learning more about Cryo-Electron Microscopy, the following LMB video, which features Richard Henderson and colleagues, may be of interest:


Notes

 
[1]
 
The Nobel Prize in Chemistry 2017.
 
[2]
 
Both Richard and Venki remain Group Leaders at the LMB and are actively involved in new scientific research.
 
[3]
 
Data Visualisation – A Scientific Treatment.
 
[4]
 
Her thesis was passed without correction – an uncommon occurrence – and her contribution to the field was described as significant in the formal documentation.
 
[5]
 
More precisely this description applies to Transmission Electron Microscopes, which are the type of kit used in Cryo-EM.
 
[6]
 
The wave-particle duality that readers may be familiar with when speaking about light waves / photons also applies to all sub-atomic particles. Electrons have both a wave and a particle nature and so, in particular, have wavelengths.
 
[7]
 
This is still the case even if ultraviolet or more energetic light is used instead of visible light.
 
[8]
 
Cathode rays are of course just beams of electrons.
 
[9]
 
Henderson, R. (2013). Avoiding the pitfalls of single particle cryo-electron microscopy: Einstein from noise. PNAS This opens a PDF.
 
[10]
 
This is an example of Richard being very, very polite.
 
[11]
 
Shatsky, M., Hall, R.J., Brenner, S.E., Glaeser, R.M. (2009). A method for the alignment of heterogeneous macromolecules from electron microscopy. JSB This article is behind a paywall.
 
[12]
 
There are a couple of other things you need to do as well I believe.


From: peterjamesthomas.com, home of The Data and Analytics Dictionary


The revised and expanded Data and Analytics Dictionary

The Data and Analytics Dictionary

Since its launch in August of this year, the peterjamesthomas.com Data and Analytics Dictionary has received a welcome amount of attention with various people on different social media platforms praising its usefulness, particularly as an introduction to the area. A number of people have made helpful suggestions for new entries or improvements to existing ones. I have also been rounding out the content with some more terms relating to each of Data Governance, Big Data and Data Warehousing. As a result, The Dictionary now has over 80 main entries (not including ones that simply refer the reader to another entry, such as Linear Regression, which redirects to Model).

The most recently added entries are as follows:

  1. Anomaly Detection
  2. Behavioural Analytics
  3. Complex Event Processing
  4. Data Discovery
  5. Data Ingestion
  6. Data Integration
  7. Data Migration
  8. Data Modelling
  9. Data Privacy
  10. Data Repository
  11. Data Virtualisation
  12. Deep Learning
  13. Flink
  14. Hive
  15. Information Security
  16. Metadata
  17. Multidimensional Approach
  18. Natural Language Processing (NLP)
  19. On-line Transaction Processing
  20. Operational Data Store (ODS)
  21. Pig
  22. Table
  23. Sentiment Analysis
  24. Text Analytics
  25. View

It is my intention to continue to revise this resource. Adding some more detail about Machine Learning and related areas is probably the next focus.

As ever, ideas for what to include next would be more than welcome (any suggestions used will also be acknowledged).


From: peterjamesthomas.com, home of The Data and Analytics Dictionary


Hurricanes and Data Visualisation: Part I – Rainbow’s Gravity

The Gravity of Rainbows

This is the first of two articles whose genesis was the nexus of hurricanes and data visualisation. The second article, Part II – Map Reading, has now been published.
 
 
Introduction

This first article is not a critique of Thomas Pynchon‘s celebrated work, instead it refers to a grave malady that can afflict otherwise health data visualisations; the use and abuse of rainbow colours. This is an area that some data visualisation professionals can get somewhat hot under the collar about; there is even a Twitter hashtag devoted to opposing this colour choice, #endtherainbow.

Hurricane Irma

The [mal-] practice has come under additional scrutiny in recent weeks due to the major meteorological events causing so much damage and even loss of life in the Caribbean and southern US; hurricanes Harvey and Irma. Of course the most salient point about these two megastorms is their destructive capability. However the observations that data visualisers make about how information about hurricanes is conveyed do carry some weight in two areas; how the public perceives these phenomena and how they perceive scientific findings in general [1]. The issues at stake are ones of both clarity and inclusiveness. Some of these people felt that salt was rubbed in the wound when the US National Weather Service, avid users of rainbows [2], had to add another colour to their normal palette for Harvey:

NWS Harvey

In 2015, five scientists collectively wrote a letter to Nature entitled “Scrap rainbow colour scales” [3]. In this they state:

It is time to clamp down on the use of misleading rainbow colour scales that are increasingly pervading the literature and the media. Accurate graphics are key to clear communication of scientific results to other researchers and the public — an issue that is becoming ever more important.

© NPG. Used under license 4186731223352 Copyright Clearance Center

At this point I have to admit to using rainbow colour schemes myself professionally and personally [4]; it is often the path of least resistance. I do however think that the #endtherainbow advocates have a point, one that I will try to illustrate below.
 
 
Many Marvellous Maps

Let’s start by introducing the idyllic coastal county of Thomasshire, a map of which appears below:

Coastal Map 1

Of course this is a cartoon map, it might be more typical to start with an actual map from Google Maps or some other provider [5], but this doesn’t matter to the argument we will construct here. Let’s suppose that – rather than anything as potentially catastrophic as a hurricane – the challenge is simply to record the rainfall due to a nasty storm that passed through this shire [6]. Based on readings from various weather stations (augmented perhaps by information drawn from radar), rainfall data would be captured and used to build up a rain contour map, much like the elevation contour maps that many people will recall from Geography lessons at school [7].

If we were to adopt a rainbow colour scheme, then such a map might look something like the one shown below:

Coastal Map 2

Here all areas coloured purple will have received between 0 and 10 cm of rain, blue between 10 and 20 cm of rain and so on.

At this point I apologise to any readers who suffer from migraine. An obvious drawback of this approach is how garish it is. Also the solid colours block out details of the underlying map. Well something can be done about both of these issues by making the contour colours transparent. This both tones them down and allows map details to remain at least semi-visible. This gets us a new map:

Coastal Map 3

Here we get into the core of the argument about the suitability of a rainbow palette. Again quoting from the Nature letter:

[…] spectral-type colour palettes can introduce false perceptual thresholds in the data (or hide genuine ones); they may also mask fine detail in the data. These palettes have no unique perceptual ordering, so they can de-emphasize data extremes by placing the most prominent colour near the middle of the scale.

[…]

Journals should not tolerate poor visual communication, particularly because better alternatives to rainbow scales are readily available (see NASA Earth Observatory).

© NPG. Used under license 4186731223352 Copyright Clearance Center

In our map, what we are looking to do is to show increasing severity of the deluge as we pass from purple (indigo / violet) up to red. But the ROYGBIV [8] colours of the spectrum are ill-suited to this. Our eyes react differently to different colours and will not immediately infer the gradient in rainfall that the image is aiming to convey. The NASA article the authors cite above uses a picture to paint a thousand words:

NASA comparison of colour palettes
Compared to a monochromatic or grayscale palette the rainbow palette tends to accentuate contrast in the bright cyan and yellow regions, but blends together through a wide range of greens.
Sourced from NASA

Another salient point is that a relatively high proportion of people suffer from one or other of the various forms of colour blindness [9]. Even the most tastefully pastel rainbow chart will disadvantage such people seeking to derive meaning from it.
 
 
Getting Over the Rainbow

So what could be another approach? Well one idea is to show gradients of whatever the diagram is tracking using gradients of colour; this is the essence of the NASA recommendation. I have attempted to do just this in the next map.

Coastal Map 4

I chose a bluey-green tone both as it was to hand in the Visio palette I was using and also to avoid confusion with the blue sea (more on this later). Rather than different colours, the idea is to map intensity of rainfall to intensity of colour. This should address both colour-blindness issues and the problems mentioned above with discriminating between ROYGBIV colours. I hope that readers will agree that it is easier to grasp what is happening at a glance when looking at this chart than in the ones that preceded it.

However, from a design point of view, there is still one issue here; the sea. There are too many bluey colours here for my taste, so let’s remove the sea colouration to get:

Coastal Map 5

Some purists might suggest also turning the land white (or maybe a shade of grey), others would mention that the grid-lines add little value (especially as they are not numbered). Both would probably have a point, however I think that use can also push minimalism too far. I am pretty happy that our final map delivers the information it is intended to convey much more accurately and more immediately than any of its predecessors.

Comparing the first two rainbow maps to this last one, it is perhaps easy to see why so many people engaged in the design of data visualisations want to see an end to ROYGBIV palettes. In the saying, there is a pot of gold at the end of the rainbow, but of course this can never be reached. I strongly suspect that, despite the efforts of the #endtherainbow crowd, an end to the usage of this particular palette will be equally out of reach. However I hope that this article is something that readers will bear in mind when next deciding on how best to colour their business graph, diagram or data visualisation. I am certainly going to try to modify my approach as well.
 
 
The story of hurricanes and data visualisation will continue in Part II – Map Reading.


Notes

 
[1]
 
For some more thoughts on the public perception of science, see Toast.
 
[2]
 
I guess it’s appropriate from at least one point of view.
 
[3]
 
Scrap rainbow colour scales. Nature (519, 219, 2015)

  • Ed Hawkins – National Centre for Atmospheric Science, University of Reading, UK (@ed_hawkins)
  • Doug McNeall – Met Office Hadley Centre, Exeter, UK (@dougmcneall)
  • Jonny Williams – University of Bristol, UK (LinkedIn page)
  • David B. Stephenson – University of Exeter, UK (Academic page)
  • David Carlson – World Meteorological Organization, Geneva, Switzerland (retired June 2017).
 
[4]
 
I did also go through a brief monochromatic phase, but it didn’t last long.
 
[5]
 
I guess it might take some time to find Thomasshire on Google Maps.
 
[6]
 
Based on the data I am graphing here, it was a very nasty storm indeed! In this article, I am not looking for realism, just to make some points about the design of diagrams.
 
[7]
 
Contour Lines (click for a larger version)
Click to view a larger version.
Sourced from UK Ordnance Survey

Whereas contours on a physical geography map (see above) link areas with the same elevation above sea level, rainfall contour lines would link areas with the same precipitation.

 
[8]
 
Red, Orange, Yellow, Green, Blue, Indigo, Violet.
 
[9]
 
Red–green color blindness, the most common sort, affects 80 in 1,000 of males and 4 in 1,000 of females of Northern European descent.


From: peterjamesthomas.com, home of The Data and Analytics Dictionary


A truth universally acknowledged…

£10 note

  “It is a truth universally acknowledged, that an organisation in possession of some data, must be in want of a Chief Data Officer”

— Growth and Governance, by Jane Austen (1813) [1]


I wrote about a theoretical job description for a Chief Data Officer back in November 2015 [2]. While I have been on “paternity leave” following the birth of our second daughter, a couple of genuine CDO job specs landed in my inbox. While unable to respond for the aforementioned reasons, I did leaf through the documents. Something immediately struck me; they were essentially wish-lists covering a number of data-related fields, rather than a description of what a CDO might actually do. Clearly I’m not going to cite the actual text here, but the following is representative of what appeared in both requirement lists:

CDO wishlist

Mandatory Requirements:

Highly Desirable Requirements:

  • PhD in Mathematics or a numerical science (with a strong record of highly-cited publications)
  • MBA from a top-tier Business School
  • TOGAF certification
  • PRINCE2 and Agile Practitioner
  • Invulnerability and X-ray vision [3]
  • Mastery of the lesser incantations and a cloak of invisibility [3]
  • High midi-chlorian reading [3]
  • Full, clean driving licence

Your common, all-garden CDO

The above list may have descended into farce towards the end, but I would argue that the problems started to occur much earlier. The above is not a description of what is required to be a successful CDO, it’s a description of a Swiss Army Knife. There is also the minor practical point that, out of a World population of around 7.5 billion, there may well be no one who ticks all the boxes [4].

Let’s make the fallacy of this type of job description clearer by considering what a simmilar approach would look like if applied to what is generally the most senior role in an organisation, the CEO. Whoever drafted the above list of requirements would probably characterise a CEO as follows:

  • The best salesperson in the organisation
  • The best accountant in the organisation
  • The best M&A person in the organisation
  • The best customer service operative in the organisation
  • The best facilities manager in the organisation
  • The best janitor in the organisation
  • The best purchasing clerk in the organisation
  • The best lawyer in the organisation
  • The best programmer in the organisation
  • The best marketer in the organisation
  • The best product developer in the organisation
  • The best HR person in the organisation, etc., etc., …

Of course a CEO needs to be none of the above, they need to be a superlative leader who is expert at running an organisation (even then, they may focus on plotting the way forward and leave the day to day running to others). For the avoidance of doubt, I am not saying that a CEO requires no domain knowledge and has no expertise, they would need both, however they don’t have to know every aspect of company operations better than the people who do it.

The same argument applies to CDOs. Domain knowledge probably should span most of what is in the job description (save for maybe the three items with footnotes), but knowledge is different to expertise. As CDOs don’t grow on trees, they will most likely be experts in one or a few of the areas cited, but not all of them. Successful CDOs will know enough to be able to talk to people in the areas where they are not experts. They will have to be competent at hiring experts in every area of a CDO’s purview. But they do not have to be able to do the job of every data-centric staff member better than the person could do themselves. Even if you could identify such a CDO, they would probably lose their best staff very quickly due to micromanagement.

Conducting the data orchestra

A CDO has to be a conductor of both the data function orchestra and of the use of data in the wider organisation. This is a talent in itself. An internationally renowned conductor may have previously been a violinist, but it is unlikely they were also a flautist and a percussionist. They do however need to be able to tell whether or not the second trumpeter is any good or not; this is not the same as being able to play the trumpet yourself of course. The conductor’s key skill is in managing the efforts of a large group of people to create a cohesive – and harmonious – whole.

The CDO is of course still a relatively new role in mainstream organisations [5]. Perhaps these job descriptions will become more realistic as the role becomes more familiar. It is to be hoped so, else many a search for a new CDO will end in disappointment.

Having twisted her text to my own purposes at the beginning of this article, I will leave the last words to Jane Austen:

  “A scheme of which every part promises delight, can never be successful; and general disappointment is only warded off by the defence of some little peculiar vexation.”

— Pride and Prejudice, by Jane Austen (1813)


Notes

 
[1]
 
Well if a production company can get away with Pride and Prejudice and Zombies, then I feel I am on reasonably solid ground here with this title.

I also seem to be riffing on JA rather a lot at present, I used Rationality and Reality as the title of one of the chapters in my [as yet unfinished] Mathematical book, Glimpses of Symmetry.

 
[2]
 
Wanted – Chief Data Officer.
 
[3]
 
Most readers will immediately spot the obvious mistake here. Of course all three of these requirements should be mandatory.
 
[4]
 
To take just one example, gaining a PhD in a numerical science, a track record of highly-cited papers and also obtaining an MBA would take most people at least a few weeks of effort. Is it likely that such a person would next focus on a PRINCE2 or TOGAF qualification?
 
[5]
 
I discuss some elements of the emerging consensus on what a CDO should do in: 5 Themes from a Chief Data Officer Forum and 5 More Themes from a Chief Data Officer Forum.


From: peterjamesthomas.com, home of The Data and Analytics Dictionary


The peterjamesthomas.com Data and Analytics Dictionary

The Data and Analytics Dictionary

I find myself frequently being asked questions around terminology in Data and Analytics and so thought that I would try to define some of the more commonly used phrases and words. My first attempt to do this can be viewed in a new page added to this site (this also appears in the site menu):

The Data and Analytics Dictionary

I plan to keep this up-to-date as the field continues to evolve.

I hope that my efforts to explain some concepts in my main area of specialism are both of interest and utility to readers. Any suggestions for new entries or comments on existing ones are more than welcome.


An in-depth Interview with Allan Engelhardt about Analytics

In-depth with Allan Engelhardt


Part of the In-depth series of interviews


PJT Today’s interview is with Allan Engelhardt, co-founder and principal of insights and analytics consultancy Cybaea. Allan and I know each other from when we both worked at Bupa. I was interested to understand the directions that he has been pursuing in recent years.
PJT Allan, we know each other well, but could you provide a pen picture of your career to date and the types of work that you have been engaged in?
AE I started out in experimental physics working on (very) big data from CERN, the large research lab near Geneva, and worked there after getting my degree. Then, like many other physicists, I was recruited into financial services, in my case to do risk management. From there to a consultancy helping business make use of bleeding edge technology and then on to CRM and customer loyalty. This last move was important for me, allowing me to move beyond the technology to be as much about commercial business strategy and operations.

In 2002 a couple of us left the consultancy to help customers move beyond transactional infrastructure, which is really what ‘CRM’ was about at the time, to create high value solution on top, and to create the organizational and commercial ownership of the customer needed to consistently drive value from data, inventing the concept of Customer Value Management which is now universally implemented by telcos across the world and increasingly adopted by other industries.

PJT There is no ISO definition of either insight or analytics. As an expert in these fields, can I ask you to offer your take on the meaning of these terms?
AE To me analytics is about finding meaning from information and data, while insights is about understanding the business opportunities in that meaning. But different people use the terms differently.
PJT I must give you an opportunity to both explain what Cybaea does and how the name came about.
AE At Cybaea we are passionate about value creation and commercial results. We have been called ‘Management consultants with a black belt in data’ and we help organizations identify and act upon data driven opportunities in the areas of:

Cybaea offering

  1. Customer Value Management (CVM), including acquisition, churn, cross-sell, segmentation, and more, across online and offline channels and industries, both B2C and B2B.
  2. Customer Experience and Advocacy, including Net Promoter System and Net Promoter Economics, customer journey optimization, and customer experience.
  3. Innovation and Growth, including data-driven product and proposition development, data monetisation, and distribution and sales strategy.

For our customers, CVM projects typically deliver additional 5% EBITDA growth annually, which you can measure very robustly because much of it is direct marketing. Experience and Advocacy projects typically deliver in the region of 20% EBITDA improvement to our clients, but it is harder to measure accurately because you must go above the line for this level of impact. And for Innovation and Growth, the sky is the limit.

As for the name, we founded the company in 2002 and wanted a short domain name that was a real word. It turned out to be difficult to find an available, short ‘.com’ at the peak of the dot-bomb era! We settled on ‘cybaea’ which my Latin dictionary translated as ‘trading vessel’; historically, it was a type of merchant ship of Greek origin, common in the Mediterranean, which Cicero describes as “most beautiful and richly adorned”. We always say we want to change the name, but it never happens; I guess if it was good enough for Cicero, then it is good enough for us.

PJT While at Bupa you led work that was very beneficial to the organisation and which is now the subject of a public Cybaea case study, can you tell readers a bit more about this?
AE Certainly, and the case study is available at for anyone who wants to read more.

This was working with Bupa Global; a Bupa business unit that primarily provides international private medical insurance for 2 million customers living in over 195 different countries. Towards the end of 2013, Bupa Global set out on a strategic journey to deliver sustained growth. A key element of this was the design and launch of a completely new set of products and propositions, replacing the existing portfolio, with the objective of attracting and servicing new customer segments, complying with changing regulation and meeting customer expectations.

The strategic driver was therefore very much in the Innovation and Growth space we outlined above, and I joined Bupa’s global Leadership Team to create and lead the commercial insights function that would support this change with deep understanding of the target customers and the markets in which they live. Additionally, Bupa had very high ambitions for its Net Promoter programme (Experience and Advocacy) where we delivered the most advanced installation across the global business, and for Customer Value Management we demonstrated nearly 2% reduction in the Claims line (EBITDA) from one single project.

For the new propositions, we initially interviewed over 3,000 individuals on five continents to understand value- and purchase drivers, researched 195 markets to size demand across all customer segments, and further deep-dived into key markets to understand the competitors with products, features, and prices, as well as the regulatory environment, and distribution options. This was supported by a very practical Customer Lifetime Value model, which we developed.

Suffice to say that in two years we had designed and implemented a completely new set of propositions and taken them live in more than twenty priority markets where they replaced the old products.

The strategic and commercial results were clearly delivered. But when I asked our CEO what he thought was the main contribution of the team and the new insights function, he focused on trust: “Every major strategic decision we made was backed by robust data and deep insights in which the executive team had full confidence.”

In a period of change, trust is perhaps the key currency. Trust that you are doing the right things for the right reasons, and the ability to explain why that is. This is key to get everybody behind the changes that need to happen. This is what the scientific method applied to data, analytics, and insights can bring to a commercial organization, and it inspires me to continue what we are doing.

PJT We have both been engaged in what is now generally called the Data arena for many years, some aspects of the technology employed have changed a lot during this time. What do you think modern technology enables today that was harder to achieve in the past and are there any areas where things are much the same as they were a decade or more ago?
AE Ever since the launch of the Amazon EC2 cloud computing service in late 2006 [1], data storage and processing infrastructure has been easily and cheaply available to everybody for most practical workloads. So, for ten years you have not had any excuse for not getting your data in order and doing serious analysis.

The main trend that excites me now is the breakthroughs happening in Deep Learning and Natural Language Processing, expanding the impact of data into completely new areas. This is great for consumers and for those companies that are at the leading edge of analytics and insights. For other organizations, however, who are struggling to deliver value from data, it means that the gap between where they are versus best practice is widening exponentially, which is a big worry.

PJT Taking technology to one side, what do you think are the main factors in successfully generating insight and developing analytical capabilities that are tightly coupled with value generation?
AE Two things are always at the forefront of my mind. The first is kind of obvious, namely to start with the business value you are trying to create and work backwards from that. Too often we see people start with the data (‘I got to clean all the data in my warehouse first!’), the technology (‘We need some Big Data infrastructure!’), or the analytics (‘We need a predictive churn model!’). That is cart before the horse. Not that these things are not important; rather, that there are almost certainly a lot of opportunities you could execute right now to generate real and measurable business value and drive a faster return on your investments.

The second is to not under-estimate the business change that is needed to exploit the insights. Analytical leaders have appetite for change and they plan and resource accordingly. Data and models are only part of the project to deliver the value and they are really clear on this.

PJT Looking at the other side of the coin, what at the pitfalls to look out for and do you have any recommendations for avoiding them?
AE The flip-side of the two points previously mentioned are obvious pitfalls: not starting from the business change and value you are trying to create. And it is not easy: great data scientists are not always great commercially-minded business people and so you need the right kind of skills to bridge that gap. McKinsey talks of ‘business translators who combine data savvy with industry and functional expertise’, which is a helpful summary [2]. Less helpfully they also note that these people are nearly impossible to find, so you may need to find or grow them internally.

Which gets to a second pitfall. When thinking about generating value from data, many want to do it all themselves. And I understand why: after all, data may well be a strategic asset for your organization.

But when you recruit, you should be clear in your mind if you are recruiting to deliver the change of creating the first models and changed business processes, or if you are recruiting to sustain the change by keeping the models current and incrementally improving the insights and processes. These two outcomes require people with quite different skills and vastly different temperaments.

We call them Explorers versus Farmers.

For the first, you want commercially-focused business people who can drive change in the organization; who can make things work quickly, whether that is data, analytics, or business processes, to demonstrate value; and who are supremely comfortable with uncertainties and unknowns.

For the second, you want people who are technically skilled to deliver and maintain the optimal stable platform and who love doing incremental improvements to technology, data, and business processes.

Explorers versus Farmers. Call them what you will, but note that they are different.

PJT Many companies are struggling with how to build analytical teams. Do they grow their own talent, do they hire numerate graduates or post graduates, do they seek to employ highly skilled and experienced individuals, do they form partnerships with external parties, or is a mixture of all of these approaches sensible? What approaches do you see at Cybaea clients adopting?
AE We are mostly seeing one of two approaches: one is to do nothing and soldier on as always relying on traditional business intelligence while the other is to hire usually highly technical people to build an internal team. Neither is optimal in getting to the value.

The do-nothing approach can make sense. Not, however, when it is adopted because management fears change (change will happen, regardless) or because they feel they don’t understand data (everybody understands data if it is communicated well). Those companies are just leaving money on the table: every organization have quick wins that can deliver value in weeks.

But it may be that you have no capacity for change and have made the informed decision that data and analytics must wait, reflecting the commercial reality. The key here is ‘informed’ and the follow-on question is if there are other ways that the company can realise some of the value from data right now.

The second approach at least recognises the value potential of data and aims to move the organization towards realising that value. But it is back to those ‘business translator’ roles we discussed before and making sure you have them, as well as making sure the business is aligned around the change that will be needed. Making money from data is a business function, not a technical one, and the function that drives the change must sit within the commercial business, not in IT or some other department that is still an arms-length support function.

We see the best organizations, the analytical leaders, employing flexible approaches. They focus on the outcomes and they have a sense of urgency driven from the top. They make it work.

PJT I know that a concept you are very interested in is Analytics as a Service (AaaS). Can you tell readers some more about what this means and also the work that Cybaea is doing in this area?
AE There is a war on analytical talent and a ‘winner takes it all’ dynamic is emerging with medium-sized enterprises especially losing out. Good people want to work with good people which generates a strong network effect giving advantage to large organizations with larger analytical teams and more variety of applications. Leading firms have depth of analytical talent and can recruit, trial, and filter more candidates, leaving them with the best talent.

Our analytics-as-a-service offering is for organizations of any size who want to realise value from data and insights right now, but who are not yet ready to build their own internal teams. We partner with the commercial teams to be their (commercial) insights function and deliver not just reports but real business change. Customers can pay monthly, pay for results, or we can do a build-operate-transfer model.

One of our first projects was with a small telco. They were too small to maintain a strong analytical team in-house, purely because of scale. We set up a monthly workshop with the commercial Marketing team. We analysed their data offline and used the time for a structured conversation about the new campaigns and the new changes to the web site they should implement this month. We would point them to our reports and dashboards which had models, graphs, t-tests, and p-values in abundance, but would focus the conversation on moving the business forward.

The following month we would repeat and identify new campaigns and new changes. After six months, they had more than 20 highly effective and precisely targeted campaigns running, and we handed over the maintenance (‘farming’) of the models to their IT teams. It is a model that works well across industries.

PJT Do you have a view on how the insights and analytics field is likely to change in coming years? Are there any emerging areas which you think readers should keep an eye on?
AE Many people are focused on the data explosion that is often called the ‘Internet of Things’ but more broadly means that more data gets generated and we consume more data for our analytics. I do think this opens tremendous opportunities for many businesses and technically I am excited to get back to processing live event streams as they happen.

But practically, we are seeing more success from deep learning. We have found that once an organization successfully implements one solution, whether artificial intelligence or complex natural language processing, then they want more. It is that powerful and that transformational, and breakthroughs in these fields are further expanding the impact into completely new area. My advice is that most organizations should at least trial what these approaches can do for them, and we have set up a sister-organization to develop and deliver solutions here.

PJT What are your plans for Cybaea in coming months?
AE I have two main priorities. First, I have our long-standing partner from India in London for a couple of months to figure out how we scale in the UK. This is for the analytics as a service but also for fast projects to deliver insights or analytical tools and applications.

Second, I am looking to identify the right partners and associates for Cybaea here in the UK to allow us to grow the business. We have great assets in our methodologies, clients, and people, and a tremendous opportunity for delivering commercial value from data, so I am very excited for the future.

PJT Allan, I would like to thank you for sharing with us the benefit of your experience and expertise in data matters, both of which have been very illuminating.

Allan Engelhardt can be reached at Allan.Engelhardt@cybaea.net. Cybaea’s website is www.cybaea.net and they have social media presence on LinkedIn and Google+.


Disclosure: Neither peterjamesthomas.com Ltd. nor any of its directors have any direct financial interest in either Cybaea or any of the other organisations mentioned in this article.


If you are a Chief Data Officer, a Chief Analytics Officer, a Director of Data, or hold some other “Top Data Job” and would like to share your thoughts with the readers of this site in an interview like this one, please get in contact.

 
Notes

 
[1]
 
https://aws.amazon.com/about-aws/whats-new/2006/08/24/announcing-amazon-elastic-compute-cloud-amazon-ec2—beta/
 
[2]
 
McKinsey report The Age of Analytics, dated December 2016, http://www.mckinsey.com/business-functions/mckinsey-analytics/our-insights/the-age-of-analytics-competing-in-a-data-driven-world

From: peterjamesthomas.com, home of The Data and Analytics Dictionary, The Anatomy of a Data Function and A Brief History of Databases


Knowing what you do not Know

Measure twice cut once

As readers will have noticed, my wife and I have spent a lot of time talking to medical practitioners in recent months. The same readers will also know that my wife is a Structural Biologist, whose work I have featured before in Data Visualisation – A Scientific Treatment [1]. Some of our previous medical interactions had led to me thinking about the nexus between medical science and statistics [2]. More recently, my wife had a discussion with a doctor which brought to mind some of her own previous scientific work. Her observations about the connections between these two areas have formed the genesis of this article. While the origins of this piece are in science and medicine, I think that the learnings have broader applicability.


So the general context is a medical test, the result of which was my wife being told that all was well [3]. Given that humans are complicated systems (to say the very least), my wife was less than convinced that just because reading X was OK it meant that everything else was also necessarily OK. She contrasted the approach of the physician with something from her own experience and in particular one of the experiments that formed part of her PhD thesis. I’m going to try to share the central point she was making with you without going in to all of the scientific details [4]. However to do this I need to provide at least some high-level background.

Structural Biology is broadly the study of the structure of large biological molecules, which mostly means proteins and protein assemblies. What is important is not the chemical make up of these molecules (how many carbon, hydrogen, oxygen, nitrogen and other atoms they consist of), but how these atoms are arranged to create three dimensional structures. An example of this appears below:

The 3D structure of a bacterial Ribosome

This image is of a bacterial Ribosome. Ribosomes are miniature machines which assemble amino acids into proteins as part of the chain which converts information held in DNA into useful molecules [5]. Ribosomes are themselves made up of a number of different proteins as well as RNA.

In order to determine the structure of a given protein, it is necessary to first isolate it in sufficient quantity (i.e. to purify it) and then subject it to some form of analysis, for example X-ray crystallography, electron microscopy or a variety of other biophysical techniques. Depending on the analytical procedure adopted, further work may be required, such as growing crystals of the protein. Something that is generally very important in this process is to increase the stability of the protein that is being investigated [6]. The type of protein that my wife was studying [7] is particularly unstable as its natural home is as part of the wall of cells – removed from this supporting structure these types of proteins quickly degrade.

So one of my wife’s tasks was to better stabilise her target protein. This can be done in a number of ways [8] and I won’t get into the technicalities. After one such attempt, my wife looked to see whether her work had been successful. In her case the relative stability of her protein before and after modification is determined by a test called a Thermostability Assay.

Sigmoidal Dose Response Curve A
© University of Cambridge – reproduced under a Creative Commons 2.0 licence

In the image above, you can see the combined results of several such assays carried out on both the unmodified and modified protein. Results for the unmodified protein are shown as a green line [9] and those for the modified protein as a blue line [10]. The fact that the blue line (and more particularly the section which rapidly slopes down from the higher values to the lower ones) is to the right of the green one indicates that the modification has been successful in increasing thermostability.

So my wife had done a great job – right? Well things were not so simple as they might first seem. There are two different protocols relating to how to carry out this thermostability assay. These basically involve doing some of the required steps in a different order. So if the steps are A, B, C and D, then protocol #1 consists of A ↦ B ↦ C ↦ D and protocol #2 consists of A ↦ C ↦ B ↦ D. My wife was thorough enough to also use this second protocol with the results shown below:

Sigmoidal Dose Response Curve B
© University of Cambridge – reproduced under a Creative Commons 2.0 licence

Here we have the opposite finding, the same modification to the protein seems to have now decreased its stability. There are some good reasons why this type of discrepancy might have occurred [11], but overall my wife could not conclude that this attempt to increase stability had been successful. This sort of thing happens all the time and she moved on to the next idea. This is all part of the rather messy process of conducting science [12].

I’ll let my wife explain her perspective on these results in her own words:

In general you can’t explain everything about a complex biological system with one set of data or the results of one test. It will seldom be the whole picture. Protocol #1 for the thermostability assay was the gold standard in my lab before the results I obtained above. Now protocol #1 is used in combination with another type of assay whose efficacy I also explored. Together these give us an even better picture of stability. The gold standard shifted. However, not even this bipartite test tells you everything. In any complex system (be that Biological or a complicated dataset) there are always going to be unknowns. What I think is important is knowing what you can and can’t account for. In my experience in science, there is generally much much more that can’t be explained than can.

Belt and Braces [or suspenders if you are from the US, which has quite a different connotation in the UK!]

As ever translating all of this to a business context is instructive. Conscientious Data Scientists or business-focussed Statisticians who come across something interesting in a model or analysis will always try (where feasible) to corroborate this by other means; they will try to perform a second “experiment” to verify their initial findings. They will also realise that even two supporting results obtained in different ways will not in general be 100% conclusive. However the highest levels of conscientiousness may be more honoured in breach than observance [13]. Also there may not be an alternative “experiment” that can be easily run. Whatever the motivations or circumstances, it is not beyond the realm of possibility that some Data Science findings are true only in the same way that my wife thought she had successfully stabilised her protein before carrying out the second assay.

I would argue that business will often have much to learn from the levels of rigour customary in most scientific research [14]. It would be nice to think that the same rigour is always applied in commercial matters as academic ones. Unfortunately experience would tend to suggest the contrary is sometimes the case. However, it would also be beneficial if people working on statistical models in industry went out of their way to stress not only what phenomena these models can explain, but what they are unable to explain. Knowing what you don’t know is the first step towards further enlightenment.


Notes

 
[1]
 
Indeed this previous article had a sub-section titled Rigour and Scrutiny, echoing some of the themes in this piece.
 
[2]
 
See More Statistics and Medicine.
 
[3]
 
As in the earlier article, apologies for the circumlocution. I’m both looking to preserve some privacy and save the reader from boredom.
 
[4]
 
Anyone interested in more information is welcome to read her thesis which is in any case in the public domain. It is 188 pages long, which is reasonably lengthy even by my standards.
 
[5]
 
They carry out translation which refers to synthesising proteins based on information carried by messenger RNA, mRNA.
 
[6]
 
Some proteins are naturally stable, but many are not and will not survive purification or later steps in their native state.
 
[7]
 
G Protein-coupled Receptors or GPCRs.
 
[8]
 
Chopping off flexible sections, adding other small proteins which act as scaffolding, getting antibodies or other biological molecules to bind to the protein and so on.
 
[9]
 
Actually a sigmoidal dose-response curve.
 
[10]
 
For anyone with colour perception problems, the green line has markers which are diamonds and the blue line has markers which are triangles.
 
[11]
 
As my wife writes [with my annotations]:

A possible explanation for this effect was that while T4L [the protein she added to try to increase stability – T4 Lysozyme] stabilised the binding pocket, the other domains of the receptor were destabilised. Another possibility was that the introduction of T4L caused an increase in the flexibility of CL3, thus destabilising the receptor. A method for determining whether this was happening would be to introduce rigid linkers at the AT1R-T4L junction [AT1R was the protein she was studying, angiotensin II type 1 receptor], or other placements of T4L. Finally AT1R might exist as a dimer and the addition of T4L might inhibit the formation of dimers, which could also destabilise the receptor.

© University of Cambridge – reproduced under a Creative Commons 2.0 licence

 
[12]
 
See also Toast.
 
[13]
 
Though to be fair, the way that this phrase is normally used today is probably not what either Hamlet or Shakespeare intended by it back around 1600.
 
[14]
 
Of course there are sadly examples of specific scientists falling short of the ideals I have described here.


Elephants’ Graveyard?

Elephants' Graveyard
 
Introduction

My young daughter is very fond of elephants [1], as indeed am I, so I need to tread delicately here. I recent years, the world has been consumed with Big Data Fever [2] and this has been intimately entwined with Hadoop of yellow elephant fame. Clearly there are very many other products such as Apache [insert random word here] [3] which are part of the Big Data ecosystem, but it is Hadoop that has become synonymous with Big Data and indeed conflated with many of the other Big Data technologies.

Hadoop the Elephant

I have seen some successful and innovative Big Data projects and there are clearly many benefits associated with the cluster of technologies that this term is used to describe. There are also any number of paeans to this new paradigm a mouse click, or finger touch, away [4]; indeed I have featured some myself in these pages [5]. However, what has struck me of late is that a few less positive articles have been appearing. I come to neither bury, nor praise Hadoop [6], but merely to reflect on this development. I will also touch on recent rumours that one of the Apache tribe [7], specifically Spark, may be seeking an amicable divorce from Hadoop proper [8].

In doing this, I am going to draw on two articles in particular. First Hadoop Is Falling by George Hill (@IE_George) on The Innovation Enterprise. Second The Hadoop Honeymoon is Over [9] by Martyn Richard Jones (@GoodStratTweet) on LinkedIn.

However, before I leap into analysing other people’s thoughts I will present some of my own [very basic] research, care of Google Trends.
 
 
Eine Kleine Nachtgoogling

Below I display two charts (larger versions are but a click away) tracking the volume of queries in the 2014-16 period for two terms: “hadoop” and “apache spark” [10]. On the assumption that California tends to lead trends more than it follows, I have focussed in on this part of the US.

Hadoop searches

Spark searches

Note on axes: On this blog I have occasionally spoken about the ability of images to conceal information as well as to reveal it [11]. Lest I am accused of making the same mistake, normalising both sets of data in the above graphs could give the misleading impression that the peak volume of queries for “hadoop” and “apache spark” are equivalent. This is not so. The maximum number of weekly queries for “apache spark” in the three years examined is just under a fifth of the maximum number of queries for “hadoop” [12]. So, applying a rather broad rule of thumb, people searched for “hadoop” around five times more often. However, it was not the absolute number of queries that I was interested in, but how these change over time, so I think the approach I have taken is justified. If I had not normalised, it would have been difficult to pick out the “apache spark” trend in a combined graph.

The obvious inference to be drawn is that searches for Hadoop (in California at least) are declining and those for Spark are increasing; though maybe with a bit of a fall off in volume recently. Making a cast iron connection between trends in search and trends in industry is probably a mistake [13], but the discrepancies in the two trends are at least suggestive. In the Application Development Trends article I reference (note [8]) the author states:

The Spark momentum is so great that the technology — originally positioned as a replacement for MapReduce with added real-time capabilities and in-memory processing — could break free from the reins of the Hadoop universe and become its own independent tool.

This chimes with the AtScale findings I also reported here (note [5]), which included the observation that:

Organizations who have deployed Spark in production are 85% more likely to achieve value.

One conclusion (albeit a rather tentative one) could be that while Spark is on an upward trajectory and perhaps likely to step out of the Hadoop shadow, interest in Hadoop itself is at best plateauing and possibly declining. It is against this backdrop that I’ll now consider the two articles I introduced earlier.
 
 
Trouble with Trunks

Bad Elephant!

In his article, George Hill begins by noting that:

[Hadoop] adoption appears to have more or less stagnated, leading even James Kobielus [@jameskobielus], Big Data Evangelist at IBM Analytics [14], to claim that “Hadoop declined more rapidly in 2016 from the big-data landscape than I expected” [15]

In search for a reasons behind this apparent stagnation, he hypothesises that:

[A] cause for concern is simply that one man’s big data is another man’s small data. Hadoop is designed for huge amounts of data, and as Kashif Saiyed [@rizkashif] wrote on KD Nuggets [16] “You don’t need Hadoop if you don’t really have a problem of huge data volumes in your enterprise, so hundreds of enterprises were hugely disappointed by their useless 2 to 10TB Hadoop clusters – Hadoop technology just doesn’t shine at this scale.”

Most companies do not currently have enough data to warrant a Hadoop rollout, but did so anyway because they felt they needed to keep up with the Joneses. After a few years of experimentation and working alongside genuine data scientists, they soon realize that their data works better in other technologies.

Martyn Richard Jones weighs in on this issue in more provocative style when he says:

Hadoop has grown, feature by feature, as a response to specific technical challenges in specific and somewhat peculiar businesses. When it all kicked off, the developers weren’t thinking about creating a new generic data management architecture, one for handling massive amounts of data. They were thinking of how to solve specific problems. Then it rather got out of hand, and the piecemeal scope grew like topsy as did the multifarious ways to address the product backlog.

and aligns himself with Kashif Saiyed’s comments by adding:

It also turns out that, in spite of the babbling of the usual suspects, Big Data is not for everyone, not everyone needs it, and even if some businesses benefit from analysing their data, they can do smaller Big Data using conventional rock-solid, high-performance and proven database technologies, well-architected and packaged technologies that are in wide use.

I have been around the data space long enough to have seen a number of technologies emerge, each of which was touted as solving all known problems. These included Executive Information Systems, Relational Databases, Enterprise Resource Planning, Data Warehouses, OLAP, Business Intelligence Suites and Customer Relationship Management systems. All are useful tools, I have successfully employed each of them, but at the end of the day, they are all technologies and technologies don’t sort out problems, people do [17]. Big Data enables us to address some new problems (and revisit some old ones) in novel ways and lets us do things we could not do before. However, it is no more a universal panacea than anything that has preceded it.

Gartner Hype Cycle

Big Data seems to have disappeared off of the Gartner hype cycle in 2016, perhaps as it is now viewed as having become mainstream. However, back in August 2015, it was heading downhill fast towards the rather cataclysmically named Trough of Disillusionment [18]. This reflects the unwavering fact that no technology ever lives up to its initial hype. Instead, after a period of being over-sold and an inevitable reaction to this, technologies settle down and begin to be actually useful. It seems that Gartner believes that Big Data has already gone through this rite of passage; they may well be correct in this assertion.

Hill references this himself in one of his closing comments, while ending on a more positive note:

[…] it is not the platform in itself that has caused the current issues. Instead it is perhaps the hype and association of Big Data that has done the real damage. Companies have adopted the platform without understanding it and then failed to get the right people or data to make it work properly, which has led to disillusionment and its apparent stagnation. There is still a huge amount of life in Hadoop, but people just need to understand it better.

For me there are loud and clear echos of other technologies “failing” in the past in what Hill says [19]. My experience in these other cases is that, while technologies may not have lived up to implausible initial claims, when they do genuinely fail, it is often for reasons that are all too human [20].
 
 
Summary

A racquet is a tool, right?

I had considered creating more balance in this article by adding a section making the case for the defence. I then realised that this was actually a pretty pointless exercise. Not because Hadoop is in terminal decline and denial of this would be indefensible. Not because it must be admitted that Big Data is over-hyped and under-delivers. Cases could be made that both of those statements are either false, or at least do not tell the whole story. However I think that arguments like these are the wrong things to focus on. Let me try to explain why.

Back in 2009 I wrote an article with the title A bad workman blames his [Business Intelligence] tools. This considered the all-too-prevalent practice in rock climbing and bouldering circles of buying the latest and greatest kit and assuming that performance gains would follow from this, as opposed to doing the hard work of training and practice (the same phenomenon occurs in other sports of course). I compared this to BI practitioners relying on technology as a crutch rather than focussing on four much more important things:

  1. Determining what information is necessary to drive key business decisions.
     
  2. Understanding the various data sources that are available and how they relate to each other.
     
  3. Transforming the data to meet the information needs.
     
  4. Managing the embedding of BI in the corporate culture.

I am often asked how relevant my heritage articles are to today’s world of analytics, data management, machine learning and AI. My reply is generally that what has changed is technology and little else [21]. This means that what was relevant back in 2009 remains relevant today; sometimes more so. The only area with a strong technological element in the list of four I cite above is number 3. I would agree that a lot has happened in the intervening years around how this piece can be effected. However, nothing has really changed in the other areas. We may call business questions use cases or user stories today, but they are the same thing. You still can’t really leverage data without attempting to understand it first. The need for good communication about data projects, high-quality education and strong follow-up is just as essential as it ever was.

Below I have taken the liberty of editing my own text, replacing the terms that were prevalent in data and information circles then, with the current ones.

Well if you want people to actually use analytics capabilities, it helps if the way that the technology operates is not a hindrance to this. Ideally the ease-of-use and intuitiveness of the analytical platform deployed should be a plus point for you. However, if you have the ultimate in data technology, but your analytics do not highlight areas that business people are interested in, do not provide information that influences actual decision-making, or contain numbers that are inaccurate, out-of-date, or unreconciled, then they will not be used.

I stand by these sentiments seven or eight years later. Over time the technology and terminology we use both change. I would argue that the essentials that determine success or failure seldom do.

Let’s take the undeniable hype cycle effect to one side. Let’s also discount overreaching claims that Hadoop and its related technologies are Swiss Army Knives, capable of dealing with any data situation. Let’s also set aside the string of technical objections that Martyn Richard Jones raises. My strong opinion is that when Hadoop (or Spark or the next great thing) fails, it will again most likely be a case of bad workmen blaming their tools; just as they did back in 2009.


Notes

 
[1]
 
As was Doug Cutting‘s son back in 2006. Rather than being yellow, my daughter’s favourite pachyderm is blue and called “Dee”, my wife and I have no idea why.
 
[2]
 
WHO have described the Big Data Fever situation as follows:

Phase 6, the pandemic phase, is characterized by community level outbreaks in at least one other country in a different WHO region in addition to the criteria defined in Phase 5. Designation of this phase will indicate that a global pandemic is under way.

 
[3]
 
Pick any one of: Cassandra, Flink, Flume, HBase, Hive, Impala, Kafka, Oozie, Phoenix, Pig, Spark, Sqoop, Storm and ZooKeeper.
 
[4]
 
You could start with the LinkedIn Big Data Channel.
 
[5]
 
Do any technologies grow up or do they only come of age?
 
[6]
 
The evil that open-source frameworks do lives after them; The good is oft interred with their source code; So let it be with Hadoop.
 
[7]
 
Perhaps not very respectful to Native American sensibilities, but hard to resist. No offence is intended.
 
[8]
 
Spark Poised To Break from Hadoop, Move to Cloud, Survey Says, Application Development Trends.
 
[9]
 
While functioning at the point that this article was originally written, it now appears that Martyn Richard Jones’s LinkedIn account has been suspended and the article I refer to is no longer available. The original URL was https://www.linkedin.com/pulse/hadoop-honeymoon-over-martyn-jones. I’m not sure what the issue is and whether or not the article may reappear at some later point.
 
[10]
 
A couple of points here. As “spark” is a word in common usage, the qualifier of “apache” is necessary. On the contrary, “hadoop” is not a name that is used for much beyond yellow elephants and so no qualifier is required. I could have used “apache hadoop” as the comparator, but instances of this are less frequent than for just “hadoop”. For what it is worth, although the number of queries for “apache hadoop” are fewer, the trend over time is pretty much the same as for just “hadoop”.
 
[11]
 
For example:

 
[12]
 
18% to be precise.
 
[13]
 
Though quite a few people make a nice living doing just that.
 
[14]
 
“IBM Software” in the original article, corrected to “IBM Analytics” here.
 
[15]
 
Big Data: Main Developments in 2016 and Key Trends in 2017, KD Nuggets.
 
[16]
 
Why Not So Hadoop?, KD Nuggets.
 
[17]
 
Though admittedly nowadays people sometimes sort problems by writing algorithms for machines to run, which then come up with the answer.
 
[18]
 
Which has always felt to me that it should appear on a papyrus map next to a “here be dragons” legend.
 
[19]
 
For example as in “Why Business Intelligence projects fail”.
 
[20]
 
It’s worth counting how many of the risks I enumerate in 20 Risks that Beset Data Programmes are human-centric (hint: its a multiple of ten biger than 15 and smaller than 25).
 
[21]
 
I might be tempted to answer a little differently when it comes to Artificial Intelligence.


Bigger and Better (Data)?

Is bigger really better

I was browsing Data Science Central [1] recently and came across an article by Bill Vorhies, President & Chief Data Scientist of Data-Magnum. The piece was entitled 7 Cases Where Big Data Isn’t Better and is worth a read in full. Here I wanted to pick up on just a couple of Bill’s points.

In his preamble, he states:

Following the literature and the technology you would think there is universal agreement that more data means better models. […] However […] it’s always a good idea to step back and examine the premise. Is it universally true that our models will be more accurate if we use more data? As a data scientist you will want to question this assumption and not automatically reach for that brand new high-performance in-memory modeling array before examining some of these issues.

Bill goes on to make several pertinent points including: that if your data is bad, having more of it is not necessarily a solution; that attempting to create a gigantic and all-purpose model may well be inferior to multiple, more targeted models on smaller sub-sets of data; and that there exist specific instances where a smaller data sets yields greater accuracy [2]. However I wanted to pick up directly on Bill’s point 6 of 7, in which he also references Larry Greenemeier (@lggreenemeier) of Scientific American.

  Bill Vorhies   Larry Greenemeier  

6. Sometimes We Get Hypnotized By the Overwhelming Volume of the Data and Forget About Data Provenance and Good Project Design

A few months back I reviewed an article by Larry Greenemeier [3] about the failure of Google Flu Trend analysis to predict the timing and severity of flu outbreaks based on social media scraping. It was widely believed that this Big Data volume of data would accurately predict the incidence of flu but the study failed miserably missing timing and severity by a wide margin.

Says Greenemeier, “Big data hubris is the often the implicit assumption that big data are a substitute for, rather than a supplement to, traditional data collection and analysis. The mistake of many big data projects, the researchers note, is that they are not based on technology designed to produce valid and reliable data amenable for scientific analysis. The data comes from sources such as smartphones, search results and social networks rather than carefully vetted participants and scientific instruments”.

Perhaps more pertinent to a business environment, Greenemeier’s article also states:

Context is often lacking when info is pulled from disparate sources, leading to questionable conclusions.

Ruler

Neither of these authors is saying that having greater volumes of data is a definitively bad thing; indeed Vorhies states:

In general would I still prefer to have more data than less? Yes, of course.

They are however both pointing out that, in some instances, more traditional statistical methods, applied to smaller data sets yield superior results. This is particularly the case where data are repurposed and the use to which they are put is different to the considerations when they were collected; something which is arguably more likely to be the case where general purpose Big Data sets are leveraged without reference to other information.

Also, when large data sets are collated from many places, the data from each place can have different characteristics. If this variation is not controlled for in models, it may well lead to erroneous findings.

Statistical Methods

Their final observation is that sound statistical methodology needs to be applied to big data sets just as much as more regular ones. The hope that design flaws will simply evaporate when data sets get large enough may be seducing, but it is also dangerously wrong.

Vorhies and Greenemeier are not suggesting that Big Data has no value. However they state that one of its most potent uses may well be as a supplement to existing methods, perhaps extending them, or bringing greater granularity to results. I view such introspection in Data Science circles as positive, likely to lead to improved methods and an indication of growing maturity in the field. It is however worth noting that, in some cases, leverage of Small-but-Well-Designed Data [4] is not only effective, but actually a superior approach. This is certainly something that Data Scientists should bear in mind.


Notes

 
[1]
 
I’d recommend taking a look at this site regularly. There is a high volume of articles and the quality is variable, but often there are some stand-out pieces.
 
[2]
 
See the original article for the details.
 
[3]
 
The article was in Scientific American and entitled Why Big Data Isn’t Necessarily Better Data.
 
[4]
 
I may have to copyright this term and of course the very elegant abridgement, SBWDD.


Predictions about Prediction

2017 the Road Ahead [Borrowed from Eckerson Group]

   
“Prediction and explanation are exactly symmetrical. Explanations are, in effect, predictions about what has happened; predictions are explanations about what’s going to happen.”

– John Rogers Searle


The above image is from Eckerson Group‘s article Predictions for 2017. Eckerson Group’s Founder and Principal Consultant, Wayne Eckerson (@weckerson), is someone whose ideas I have followed on-line for several years; indeed I’m rather surprised I have not posted about his work here before today.

As was possibly said by a variety of people, “prediction is very difficult, especially about the future” [1]. I did turn my hand to crystal ball gazing back in 2009 [2], but the Eckerson Group’s attempt at futurology is obviously much more up-to-date. As per my review of Bruno Aziza’s thoughts on the AtScale blog, I’m not going to cut and paste the text that Wayne and his associates have penned wholesale, instead I’d recommend reading the original article.

Here though are a number of points that caught my eye, together with some commentary of my own (the latter appears in italics below). I’ll split these into the same groups that Wayne & Co. use and also stick to their indexing, hence the occasional gaps in numbering. Where I have elided text, I trust that I have not changed the intended meaning:
 
 
Data Management

Data Management

1. The enterprise data marketplace becomes a priority. As companies begin to recognize the undesirable side effects of self-service they are looking for ways to reap self-service benefits without suffering the downside. […] The enterprise data marketplace returns us to the single-source vision that was once touted as the real benefit of Enterprise Data Warehouses.
  I’ve always thought of self-service as something of a cop-out. It tends to avoid data teams doing anything as arduous (and in some cases out of their comfort zone) as understanding what makes a business tick and getting to grips with the key questions that an organisation needs to answer in order to be successful [3]. With this messy and human-centric stuff out of the way, the data team can retreat into the comfort of nice orderly technological matters or friendly statistical models.

However, what Eckerson Group describe here is “an Amazon-like data marketplace”, which it seems to me has more of a chance of being successful. However, such a marketplace will only function if it embodies the same focus on key business questions and how they are answered. The paradigm within which such questions are framed may be different, more community based and more federated for example, but the questions will still be of paramount importance.

 
3.
 
New kinds of data governance organizations and practices emerge. Long-standing, command-and-control data governance practices fail to meet the challenges of big data and of data democratization. […]
  I think that this is overdue. To date Data Governance, where it is implemented at all, tends to be too police-like. I entirely agree that there are circumstances in which a Data Governance team or body needs to be able to put its foot down [4], but if all that Data Governance does is police-work, then it will ultimately fail. Instead good Data Governance needs to recognise that it is part of a much more fluid set of processes [5], whose aim is to add business value; to facilitate things being done as well as sometimes to stop the wrong path being taken.

 
Data Science

Data Science

1. Self-service and automated predictive analytics tools will cause some embarrassing mistakes. Business users now have the opportunity to use predictive models but they may not recognize the limits of the models themselves. […]
  I think this is a very valid point. As well as not understanding the limitations of some models [6], there is not widespread understanding of statistics in many areas of business. The concept of a central prediction surrounded by different outcomes with different probabilities is seldom seen in commercial circles [7]. In addition there seems to be a lack of appreciation of how big an impact the statistical methodology employed can have on what a model tells you [8].

 
Business Analytics

Business Analytics

1. Modern analytic platforms dominate BI. Business intelligence (BI) has evolved from purpose-built tools in the 1990s to BI suites in the 2000s to self-service visualization tools in the 2010s. Going forward, organizations will replace tools and suites with modern analytics platforms that support all modes of BI and all types of users […]
  Again, if it comes to fruition, such consolidation is overdue. Ideally the tools and technologies will blend into the background, good data-centric work is never about the technology and always about the content and the efforts involved in ensuring that it is relevant, accurate, consistent and timely [9]. Also information is often of most use when it is made available to people taking decisions at the precise point that they need it. This observation highlights the need for data to be integrated into systems and digital estates instead of simply being bound to an analytical hub.

 
So some food for thought from Wayne and his associates. The points they make (including those which I haven’t featured in this article) are serious and well-thought-out ones. It will be interesting to see how things have moved on by the beginning of 2018.


Notes

 
[1]
 
According to WikiQuotes, this has most famously been attributed to Danish theoretical physicist and father of Quantum Mechanics, Niels Bohr (in Teaching and Learning Elementary Social Studies (1970) by Arthur K. Ellis, p. 431). However it has also been ascribed to various humourists, the Danish poet Piet Hein: “det er svært at spå – især om fremtiden” and Danish cartoonist Storm P (Robert Storm Petersen). Perhaps it is best to say that a Dane made the comment and leave it at that.

Of course similar words have also been said to have been originated by Yogi Berra, but then that goes for most malapropisms you could care to mention. As Mr Berra himself says “I really didn’t say everything I said”.

 
[2]
 
See Trends in Business Intelligence. I have to say that several of these have come to pass, albeit sometimes in different ways to the ones I envisaged back then.
 
[3]
 
For a brief review of what is necessary see What should companies consider before investing in a Business Intelligence solution?
 
[4]
 
I wrote about the unpleasant side effects of a Change Programmes unfettered by appropriate Data Governance in Bumps in the Road, for example.
 
[5]
 
I describe such a set of processes in Data Management as part of the Data to Action Journey.
 
[6]
 
I explore some simmilar territory to that presented by Eckerson Group in Data Visualisation – A Scientific Treatment.
 
[7]
 
My favourite counterexample is provided by The Bank of England.

The Old Lady of Threadneedle Street is clearly not a witch
An inflation prediction from The Bank of England
Illustrating the fairly obvious fact that uncertainty increases in proportion to time from now.
 
[8]
 
This is an area I cover in An Inconvenient Truth.
 
[9]
 
I cover this assertion more fully in A bad workman blames his [Business Intelligence] tools.