

The Anatomy of a Data Function – Part II

Part I Part II Part III

Sepia's Anatomy

This is the second part of my review of the anatomy of a Data Function, the artfully named Part I may be viewed here. As seems to happen all too often to me, this series will now extend to having a Part III, which may be viewed here.

In the first article, I introduced the following Data Function organogram:
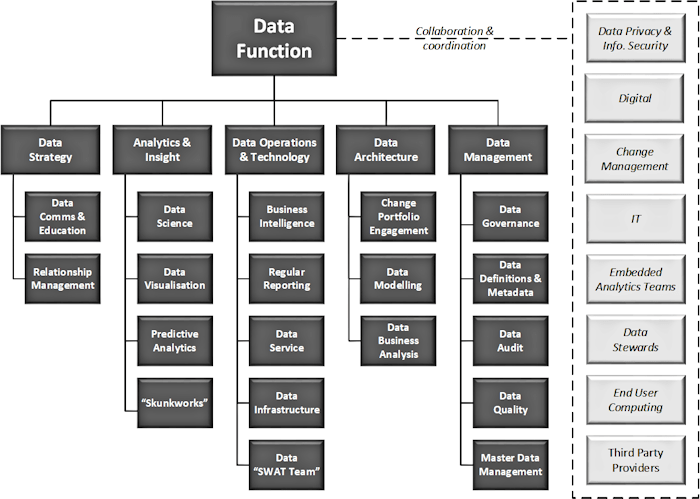
The Anatomy of a Data Function

Larger PDF version (opens in a new tab)

and went on to cover each of Data Strategy, Analytics & Insight and Data Operations & Technology. In Part II, I will consider the two remaining Data Function areas of Data Architecture and Data Management. Covering Related Areas, and presenting some thoughts on how to go about setting up a Data Function and the pitfalls to be faced along the way, together form the third and final part of this trilogy.

As in Part I, unless otherwise stated, text indented as a quotation is excerpted from the Data and Analytics Dictionary.
 
 
Data Architecture

Data Architecture

To be somewhat self-referential, this area acts a a cornerstone for the rest of the Data Function. While sometimes non-Data architects can seem to inhabit a loftier plane than most mere mortals, Data Architects (who definitively must be part of the Data Function and none of the Business, Enterprise or Solutions Architecture groups) tend to be more practical sorts with actual hands-on technical skills. Perhaps instead of the title “Architect”, “Structural Engineer” would be more appropriate. When a Data Architect draws a diagram with connected boxes, he or she generally understands how the connections work and could probably take a fair stab at implementing the linkages themselves. The other denizens of this area, such as Data Business Analysts, are also essentially pragmatic people, focused on real business outcomes. Data Architecture is a non-theoretical discipline and here I present some of the real-world activities that its members are often engaged in.
 
Change Portfolio Engagement

One of the most important services that a good Data Function can perform is to act as a moderator for the otherwise deleterious impact that uncontrolled (and uncoordinated) Change portfolios can have on even the best of data landscapes [1]. As I mention in another article:

Over the last decade or so, the delivery of technological change has evolved to the point where many streams of parallel work are run independently of each other with each receiving very close management scrutiny in order to ensure delivery on-time and on-budget. It should be recognised that some of this shift in modus operandi has been as a result of IT departments running projects that have spiralled out of control, or where delivery has been significantly delayed or compromised. The gimlet-like focus of Change on delivery “come Hell or High-water” represents the pendulum swinging to the other extreme.

What this shift in approach means in practice is that – as is often the case – when things go wrong or take longer than anticipated, areas of work are de-scoped to secure delivery dates. In my experience, 9 times out of 10 one of the things that gets thrown out is data-related work; be that not bothering to develop reporting on top of new systems, not integrating new data into existing repositories, not complying with data standards, or not implementing master data management.

As well as the danger of skipping necessary data related work, if some data-related work is actually undertaken, then corners may be cut to meet deadlines and budgets. It is not atypical for instance that a Change Programme, while adding their new capabilities to interfaces or ETL, compromises or overwrites existing functionality. This can mean that data-centric code is in a worse state after a Change Programme than before. My roadworks anecdote begins to feel all too apt a metaphor to employ.

Looking more broadly at Change Programmes, even without the curse of de-scopes, their focus is seldom data and the expertise of Change staff is not often in data matters. Because of this, such work can indeed seem to be analogous to continually digging up the same stretch of road for different purposes, combined with patching things up again in a manner that can sometimes be barely adequate. Extending our metaphor, the result of Change that is not controlled from a data point of view can be a landscape with lumps, bumps and pot-holes. Maybe the sewer was re-laid on time and to budget, but the road has been trashed in the process. Perhaps a new system was shoe-horned in to production, but rendered elements of an Analytical Repository useless in the process.

Excerpted from: Bumps in the Road

A primary responsibility of a properly constituted Data Function is to lean hard against the prevailing winds of Change in order to protect existing data capabilities that would otherwise likely be blown away [2]. Given the gargantuan size of most current Change teams, it makes sense to have at least a reasonable amount of Data Function resource applied to this area. Hopefully early interventions in projects and programmes can mitigate any potentially adverse impacts and perhaps even lead to Change being accretive to data landscapes, as it really ought to be.

The best approach, as with most human endeavours is a collaborative one, with Data Function staff (probably Data Architects) getting involved in new Change projects and programmes at an early stage and shaping them to be positive from a Data dimension. However, there also needs to be teeth in the process; on occasion the Data Function must be able to prevent work that would cause true damage from going ahead; hopefully powers that are used more in breach than observance.
 
Data Modelling

It is in this area that the practical bent of Data Architects and Data Business Analysts is seen very clearly. Data modelling mirrors the realities of systems and databases the way that Theoretical Physicists use Mathematics to model the Natural World [3]. In both cases, while there may be a degree of abstraction, the end purpose is to achieve something more concrete. A definition is as follows:

[Data Modelling is] the process of examining data sets (e.g. the database underpinning a system) in order to understand how they are structured, the relationships between their various parts and the business entities and transactions they represent. While system data will have a specific Physical Data Model (the tables it contains and their linkages), Data Modelling may instead look to create a higher-level and more abstract set of pseudo-tables, which would be easier to relate to for non-technical staff and would more closely map to business terms and activities; this is known as a Conceptual Data Model. Sitting somewhere between the two may be found Logical Data Models. There are several specific documents produced by such work, one of the most common being an Entity-Relationship diagram, e.g. a sales order has a customer and one or more line items, each of which has a product.

Data and Analytics Dictionary entry: Data Modelling

 
Data Business Analysis

Another critical role. In my long experience of both setting up Data Functions and running Data Programmes, having good Data Business Analysts on board is often the difference between success and failure. I cannot stress enough how important this role is.

Data Business Analysts are neither regular Business Analysts, nor just Data Analysts, but rather a combination of the best of both. They do have all the requirement gathering skills of the best BAs, but complement these with Data Modelling abilities, always seeking to translate new requirements into expanded or refined Data Models. Also the way that they approach business requirements will be very specific. The optimal way to do this is by teasing out (and they collating and categorising) business questions and then determining the information needed to answer these. A good Data Business Analyst will also have strong Data Analysis skills, being able to work with unfamiliar and lightly-documented datasets to discern meaning and link this to business concepts. A definition is as follows:

A person who has extensive understanding of both business processes and the data necessary to support these. A Business Analyst is expert at discerning what people need to do. A Data Analyst is adept at working with datasets and extracting meaning from them. A Data Business Analyst can work equally happily in both worlds at the same time. When they talk to people about their requirements for information, they are simultaneously updating mental models of the data necessary to meet these needs. When they are considering how lightly-documented datasets hang together, they constantly have in mind the business purpose to which such resources may be bent.

Data and Analytics Dictionary entry: Data Business Analyst

 
 
Data Management

Data Management

Again, it is worth noting that I have probably defined this area more narrowly than many. It could be argued that it should encompass the work I have under Data Architecture and maybe much of what is under Data Operations & Technology. The actual hierarchy is likely to be driven by factors like the nature of the organisation and the seniority of Managers in the Data Function. For good or ill, I have focussed Data Management more on the care and feeding of Data Assets in my recommended set-up. A definition is as follows:

The day-to-day management of data within an organisation, which encompasses areas such as Data Architecture, Data Quality, Data Governance (normally on behalf of a Data Governance Committee) and often some elements of data provision and / or regular reporting. The objective is to appropriately manage the lifecycle of data throughout the entire organisation, which both ensures the reliability of data and enables it to become a valuable and strategic asset.

In some organisations, Data Management and Analytics are part of the same organisation, in others they are separate but work closely together to achieve shared objectives.

Data and Analytics Dictionary entry: Data Management

 
Data Governance

There is a clear link here with some of the Data Architecture activities, particularly the Change Portfolio Engagement work-area. Governance should represent the strategic management of the data component of Change (i.e. most of Change), day-to-day collaboration would sit more in the Data Architecture area.

The management processes and policies necessary to ensure that data captured or generated within a company is of an appropriate standard to use, represents actual business facts and has its integrity preserved when transferred to repositories (e.g. Data Lakes and / or Data Warehouses, General Ledgers etc.), especially when this transfer involves aggregation or merging of different data sets. The activities that Data Governance has oversight of include the operation of and changes to Systems of Record and the activities of Data Management and Analytics departments (which may be merged into one unit, or discrete but with close collaboration).

Data Governance has a strategic role, often involving senior management. Day-to-day tasks supporting Data Governance are often carried out by a Data Management team.

Data and Analytics Dictionary entry: Data Governance

 
Data Definitions & Metadata

This is a relatively straightforward area to conceptualise. Rigorous and consistent definitions of master data and calculated data are indispensable in all aspects of how a Data Function operates and how an organisation both leverages and protects its data. Focusing on Metadata, a definition would be as follows:

[Metadata is] data about data. So descriptions of what appears in fields, how these relate to other fields and what concepts bigger constructs like Tables embody. This helps people unfamiliar with a dataset to understand how it hangs together and is good practice in the same way that documentation of any other type of code is good practice. Metadata can be used to support some elements of Data Discovery by less technical people. It is also invaluable when there is a need for Data Migration.

Data and Analytics Dictionary entry: Metadata

 
Data Audit

One of the challenges in driving Data Quality improvements in organisations is actually highlighting the problems and their impacts. Often poor Data Quality is a hidden cost, spread across many people taking longer to do their jobs than is necessary, or specific instances where interactions with business counterparties (including customers) are compromised. Organisations obviously cope – at least in general – with these issues, but they are a drag on efficiency and, in extremis, can lead to incidents which can cause significant financial loss and/or reputational damage. A way to make such problems more explicit is via a regular Data Audit, a review of data in source systems and as it travels through various data repositories. This would include some assessment of the completeness and overall quality of data, highlighting areas of particular concern. So one component might include the percentage of active records which suffer from a significant data quality issue.

It is important that any such issues are categorised. Are they the result of less than perfect data entry procedures, which could be tightened up? Are they due to deficient validation in transactional systems, where this could be improved and there may be a role for Master Data Management? Are data interfaces between systems to blame, where these need to be reengineered or potentially replaced? Are there architectural issues with systems or repositories, which will require remedial work to address?

This information needs to be rolled up and presented in an accessible manner so that those responsible for systems and processes can understand where issues lie. Data Audits, even if partially automated, take time and effort, so it may be appropriate to carry them out quarterly. In this case, it is valuable to understand how the situation is changing over time and also to track the – hopefully positive – impact of any remedial action. Experienced Data Analysts with a good appreciation of how business is conducted in the organisation are the type of resource best suited to Data Audit work.
 
Data Quality

Much that needs to be said here is covered in the previous section about Data Audit. Data Quality can be defined as follows:

The characteristics of data that cover how accurately and completely it mirrors real world events and thereby how much reliance can be placed on it for the purpose of generating information and insight. Enhancing Data Quality should be a primary objective of Data Management teams.

Data and Analytics Dictionary entry: Data Quality

A Data Quality team, which would work closely with Data Audit colleagues, would be focussed on helping to drive improvements. The details of such work are covered in an earlier article, from which the following is excerpted:

There are a number of elements that combine to improve the quality of data:

  1. Improve how the data is entered
  2. Make sure your interfaces aren’t the problem
  3. Check how the data is entered / interfaced
  4. Don’t suppress bad data in your BI

As with any strategy, it is ideal to have the support of all four pillars. However, I have seen greater and quicker improvements through the fourth element than with any of the others.

Excerpted from: Using BI to drive improvements in data quality

 
Master Data Management

There is some overlap here with Data Definitions & Metadata as mentioned above. Master Data Management has also been mentioned here in the context of Data Quality initiatives. However this specialist area tends to demand dedicated staff. A definition is as follows:

Master Data Management is the term used to both describe the set of process by which Master Data is created, changed and deleted in an organisation and also the technological tools that can facilitate these processes. There is a strong relation here to Data Governance, an area which also encompasses broader objectives. The aim of MDM is to ensure that the creation of business transactions results in valid data, which can then be leveraged confidently to create Information.

Many of the difficulties in MDM arise from items of Master Data that can change over time; for example when one counterparty is acquired by another, or an organisational structure is changed (maybe creating new departments and consolidating old ones). The challenges here include, how to report historical transactions that are tagged with Master Data that has now changed.

Data and Analytics Dictionary entry: Master Data Management


At this point, we have covered all of the work-areas within our idealised Data Function. In the third and final piece, we will consider the right-hand column of Related Areas, ones that a Data Function must collaborate with. Having covered these, the trilogy will close by offering some thoughts on the challenges of setting up a Data Function and how these may be overcome.
 

Part I Part II Part III

 
Notes

 
[1]
 
I am old enough to recall a time before Change portfolios, I can recall no organisation in which I have worked over the last 20 years in which Change portfolios have had a positive impact on data assets; maybe I have just been unlucky, but it begins to feel more like a fundamental Physical Law.
 
[2]
 
I have clearly been writing about hurricanes too much recently!
 
[3]
 
As is seen, for example in, the Introduction to my [as yet unfinished] book on the role of Group Theory in Theoretical Physics, Glimpses of Symmetry.


From: peterjamesthomas.com, home of The Data and Analytics Dictionary

 

The Anatomy of a Data Function – Part I

Part I Part II Part III

Back in Alphabet Soup, I presented a diagram covering what I think are good and bad approaches to organising Analytics and Data Management. I wanted to offer an expanded view [1] of the good organisation chart and to talk a bit about each of its components. Originally, I planned to address these objectives across two articles. As happens to me all too frequently, the piece has now expanded to become three parts. The second may be read here, and the third here.

Let’s leap right in and look at my suggested chart:

The Anatomy of a Data Function

Larger PDF version (opens in a new tab)

I appreciate that the above is a lot of boxes! I can feel Finance and HR staff reaching for their FTE calculators as I write. A few things to note:

  1. I have avoided the temptation to add the titles of executives, managers or team leaders. Alphabet Soup itself pointed out how tough it can be to wrestle with the nomenclature. Instead I have just focussed on areas of work.
     
  2. The term “work areas” is intentional. In larger organisations, there may be teams or individuals corresponding to each box. In smaller ones Data Function staff will wear many hats and several work areas may be covered by one person.
     
  3. In some places, a number of work areas that I have tagged as Data Function ones may be performed in other parts of the organisation, though it is to be hoped with collaboration and coordination.

Having dealt with these caveats, let’s provide some colour on each of these progressing from top to bottom and left to right. In this first article we will consider the Data Strategy, Analytics & Insight and Data Operations & Technology areas. The second part will cover the remaining elements of Data Architecture and Data Management. The final article, considers Related Areas before also covering some of the challenges that may be faced in setting up a Data Function.

In what follows, unless otherwise stated, text indented as a quotation is excerpted from the Data and Analytics Dictionary.
 
 
Data Strategy

Data Strategy

A clear strategy is obviously most important to establish in the early days of a Data Function. Indeed a Data Strategy may well call for the creation of a Data Function where none currently exists. For anyone interested in this process, I recommend my series of three articles on this subject [2]. However a Data Strategy is not something carved in stone, it will need to be revisited and adapted (maybe significantly) as circumstances change (e.g. after an acquisition, a change in market conditions or potentially due to the emergence of some new technology). There is thus a need for ongoing work in this area. However, as demand for strategic work will tend to be lumpy, I suggest amalgamating Data Strategy with the following two sub-areas.
 
Data Comms & Education

Elsewhere on this site, I have highlighted the need for effective communication, education and assiduous follow-up in data programmes [3]. Education on data matters does not stop when a data quality drive is successfully completed, or when a new set of analytical capabilities are introduced, this is a need for an ongoing commitment here. Activities falling into this work area include: publishing regular data newsletters and infographics, designing and helping to deliver training programmes, providing follow-up and support to aid the embedded used of new capabilities or to ingrain new behaviours.
 
Relationship Management

There is a need for all Data Function staff to establish and maintain good working relations with any colleagues they come into contact with, regardless of their level or influence. However, the nature of, generally hierarchical, organisations is that it is often prudent to pay special attention to more senior staff, or to the type of person (common in many companies) who may not be that senior, but whose opinion is influential. In aggregate these two groups of people are often described as stakeholders. Providing regular updates to stakeholders and ensuring both that they are comfortable with Data Function work and that this is aligned with their priorities can be invaluable [4]. Having senior, business-savvy Data Function people available to do this work is the most likely path to success.
 
 
Analytics & Insight

Analytics & Insight

Broadly speaking the Analytics area and its sub-areas are focussed more on one-off analyses rather that the recurrent production of information [5], the latter being more the preserve of the Data Operations & Technology area. There is also more of a statistical flavour to the work carried out here.

[Analytics relates to] deriving insights from data which are generally beyond the purpose for which the data was originally captured – to be contrasted with Information which relates to the meaning inherent in data (i.e. the reason that it was captured in the first place). Analytics often employ advanced statistical techniques (logistic regression, multivariate regression, time series analysis etc.) to derive meaning from data.

Data and Analytics Dictionary entry: Analytics

 
Data Science

I have Data Science as a sub-area of analytics, as with most terminology used in the data arena and most organisational units that exist in Data Functions, some people might argue that I have this the wrong way round and that Data Science should be preeminent. Reconciling different points of view is not my objective here, I think most people will agree that both work areas should be covered. This comment pertains to many other parts of this article. Here is a definition of the area (or rather the people who populate it):

[Data Scientists are people who are] au fait with exploiting data in many formats from Flat Files to Data Warehouses to Data Lakes. Such individuals possess equal abilities in the data technologies (such as Big Data) and how to derive benefit from these via statistical modelling. Data Scientists are often lapsed actual scientists.

Data and Analytics Dictionary entry: Data Scientist

 
Data Visualisation

There is an overlap here with both the Data Science team within the Analytics & Insight area and the Business Intelligence team in the Data Operations & Technology area. Many of the outputs of a good Data Function will include graphs, charts and other such exhibits. However, here would be located the real specialists, the people who would set standards for the presentation of visual data across the Data Function and be the most able in leveraging visualisation tools. A definition of Data Visualisation is as follows:

Techniques – such as graphs – for presenting complex information in a manner in which it can be more easily digested by human observers. Based on the concept that a picture paints a thousand words (or a dozen Excel sheets).

Data and Analytics Dictionary entry: Data Visualisation

 
Predictive Analytics

Gartner refer to four types of Analytics: descriptive, diagnostic, predictive and prescriptive analytics. In an article I referred to these as:

  • What happened?
  • Why did it happen?
  • What is going to happen next?
  • What should we be doing?

Data and Analytics Dictionary entry: Analytics

Predictive analytics is that element of the Analytics function that aims to predict the future, “What is going to happen next?” in the above list. This can be as simple as extrapolating data based on a trend line, or can involve more sophisticated techniques such as Time Series Analysis. As with most elements of the Data Function, there is overlap between Predictive Analytics and both Data Science and Business Intelligence.
 
“Skunkworks”

As with Data Strategy, state-of-the-art in Analytics & Insight will continue to evolve. This part of the Data Function will aim to keep current with the latest developments and to try out new techniques and new technologies that may later be adopted more widely by Data Function colleagues. The “skunkworks” team would be staffed by capable programmers / data scientists / statisticians.
 
 
Data Operations & Technology

Data Operations & Technology

It could be reasonably argued that this area is part of Data Management; I probably would not object too strongly to this suggestion. However, there are some benefits to considering it separately. This is the most IT-like of the areas considered here. It recognises that data technology (being it the Hadoop suite, Data Warehouse technology, or combinations of both) is different to many other forms of technology and needs its own specialists to focus on it. It is likely that the staff in this area will also collaborate closely with IT (see the final work area in Part II) or, in some cases, supervise work carried out by IT. As well as directly creating data capabilities, Data Operations & Technology staff would be active in the day-to-day running of these; again in collaboration with colleagues from both inside and outside of the Data Function.
 
Business Intelligence

There is no ISO definition, but I use this term as a catch-all to describe the transformation of raw data into information that can be disseminated to business people to support decision-making.

Data and Analytics Dictionary entry: Business Intelligence

This sub-area focusses on the relatively mature task of providing Business Intelligence solutions to organisations and working with IT to support and maintain these. Good BI tools work best on a sound underlying information architecture and so there would need to also be close collaboration with Data Infrastructure staff within Data Operations & Technology as well as colleagues from Data Architecture and also Analytics & Insight.
 
Regular Reporting

If BI provides interactive capabilities to support decision making, Regular Reporting is about the provision of specific key reports to relevant parties on a periodic basis; daily, weekly, monthly etc. These may be burst out to people’s e-mail accounts, provided at some central location, or both. While this an area that is ideally automated, there will still be significant need for human monitoring and to support the inevitable changes.
 
Data Service

One of the things that any part of a Data Function will find itself doing on a very regular basis is crafting ad hoc data extracts for other departments, e.g. Marketing, Risk & Compliance etc. Sometimes such a need will be on an ongoing basis and a web-service or some other Data Integration mechanism will need to be set up. Rather than having this be something that is supported out of the general running costs of the Data Function, it makes sense to have a specific unit whose role is to fulfil these needs. Even so, there may be a need for queuing and prioritisation of requests
 
Data Infrastructure

This relates to the physical architecture of the data landscape (for various flavours of logical architectures, see Data Architecture in Part II). While some of the tasks here may be carried out by (or in collaboration with) IT, the Data Infrastructure team will be expert at the care and feeding of Hadoop and related technologies and have experience in the fine-tuning of Data Warehouses and Data Marts.
 
SWAT Team

While (as both mentioned above and also covered in Part III this article) some of the heavy lifting in data matters will be carried out by an organisation’s IT team and / or its external partners, the process for getting things done in this way can be slow, tortuous and expensive [6]. It is important that a Data Function has its own capability to make at least minor technological changes, or to build and deploy helpful data facilities without having to engage with the overall bureaucracy. The SWAT Team will have a small number of very capable and business-knowledgeable programmers, capable of quickly generating robust and functional code.
 
 
The second part of this piece picks up where I have left off here and first consider Data Architecture.
 

Part I Part II Part III

 
Notes

 
[1]
 
I have added some functions that were absent in the previous one, mostly as they were not central to the points I was making in the previous article.
 
[2]
 
My trilogy on Formatting a Data / Information Strategy has the following parts:

  1. Part I – General Strategy
  2. Part II – Situational Analysis
  3. Part III – Completing the Strategy
 
[3]
 
While this theme runs through most of my writing, it is most explicitly referenced in the following three articles:

  1. Marketing Change
  2. Education and Cultural Transformation
  3. Sustaining Cultural Change
 
[4]
 
It should be noted that the relationship management described here is not the same as a Project Manager covering progress against plan. This is more of a two way conversation to ensure that the Data Function remains cognisant of stakeholder needs
 
[5]
 
Though of course sometimes one-off analyses have value on an ongoing basis and so need to be productionised. In such cases the Analytics & Insight team would work with the Data Operations & Technology team to achieve this.
 
[6]
 
No citation needed.


From: peterjamesthomas.com, home of The Data and Analytics Dictionary

 

The revised and expanded Data and Analytics Dictionary

The Data and Analytics Dictionary

Since its launch in August of this year, the peterjamesthomas.com Data and Analytics Dictionary has received a welcome amount of attention with various people on different social media platforms praising its usefulness, particularly as an introduction to the area. A number of people have made helpful suggestions for new entries or improvements to existing ones. I have also been rounding out the content with some more terms relating to each of Data Governance, Big Data and Data Warehousing. As a result, The Dictionary now has over 80 main entries (not including ones that simply refer the reader to another entry, such as Linear Regression, which redirects to Model).

The most recently added entries are as follows:

  1. Anomaly Detection
  2. Behavioural Analytics
  3. Complex Event Processing
  4. Data Discovery
  5. Data Ingestion
  6. Data Integration
  7. Data Migration
  8. Data Modelling
  9. Data Privacy
  10. Data Repository
  11. Data Virtualisation
  12. Deep Learning
  13. Flink
  14. Hive
  15. Information Security
  16. Metadata
  17. Multidimensional Approach
  18. Natural Language Processing (NLP)
  19. On-line Transaction Processing
  20. Operational Data Store (ODS)
  21. Pig
  22. Table
  23. Sentiment Analysis
  24. Text Analytics
  25. View

It is my intention to continue to revise this resource. Adding some more detail about Machine Learning and related areas is probably the next focus.

As ever, ideas for what to include next would be more than welcome (any suggestions used will also be acknowledged).


From: peterjamesthomas.com, home of The Data and Analytics Dictionary

 

Ever tried? Ever failed?

Ever Tried? Ever Failed?

Regular readers may recall my March 2017 article [1] which started by exploring failure rates of Big Data implementations. In this, amongst other facts, we learnt that between a half and two-thirds of a range of major business transformations fail to deliver lasting value [2]. After recently reading a pair of Harvard Business Review articles from back in 2016 [3], I can also add Analytics. Here is a salient quote from the second article:

Only a little more than one in three of the three-dozen companies that we studied met the objectives of their analytics initiatives over the long term. Clearly, driving major innovations with analytics was harder than many executives expected.

Once more we see what appears to be a fundamental constant emerge, around 60% of most major business endeavours cannot be classified as unqualified successes. I feel that we should come up with a name for this figure and ideally use a Greek letter to denote it, maybe φ which is as close to “F” for failure as the Greek alphabet gets [4].

Unbalanced C-suite

The authors based their study on a 20 years of research spanning 36 client companies. The drew a surprising conclusion:

Efforts to adopt analytics upset the balance of power in the C-suite, and this shift often had a negative impact on analytics initiatives.

As ever (and as indeed I concluded in my previous article) reasons for failure have little to do with technology and everything to do with humans and how they interact with each other. This is one of the reasons I get incensed by Analytics teams saying things like “the business didn’t know what they wanted” or “adoption wasn’t strong enough” when their programmes fail.

For a start, Analytics is a business discipline and the Analytics team should view themselves as a business team. Second, to me it is pretty clear that a core activity for such teams is working with stakeholders to form an appreciation of their products or services, their competitive landscape, the markets they operate in, their day-to-day challenges and, on top of all this, what they want from data; even if this requires some teasing out (e.g. spending time shadowing people or using mock-ups or prototypes to show the art of the possible). Also Analytics teams must take accountability for driving adoption themselves, rather than assuming that someone else will deal with this, or worse, that “if we build it, they will come” [5].

Handshake

The C-suite aspect is tougher, but in my own work I try to spend time with Executives to understand their world views and to make sure I align what I am doing with their priorities. Building relationships here can help to reduce the likelihood of Executive strife impacting on an Analytics programme. However, I do also agree with the authors that the CEO has a key role to play here in ensuring that his or her team embrace becoming a data-driven organisation, even if this means changes in roles and responsibilities for some.

I’d encourage readers to take a look at the original HBR material, it contains a number of other pertinent observations above and beyond the ones I have highlighted here. When either looking to prevent issues from arising, or trying to mitigating them once they do, my article, 20 Risks that Beset Data Programmes, can also be a useful reference.

Beyond this, my simplest advice is to always remember the human angle in any Analytics programme. This is more likely to determine success or failure than technical excellence, or embracing the latest and greatest Data Visualisation or Analysis tools [6].


Notes

 
[1]
 
Ideas for avoiding Big Data failures and for dealing with them if they happen.

This also includes a quote from Samuel Beckett, which provided the inspiration for the title of this article.

 
[2]
 
The specifics were, Big Data implementations, Data Warehousing, ERP systems and Mergers and Acquisitions; please see the earlier article for the source of the figures.

To this you could add any number of technology-based programmes, such as CRM implementations, Digital Transformation and even outsourcing. The main message is doing some things successfully is hard.

 
[3]
 
The articles are:

  1. How CEOs Can Keep Their Analytics Programs from Being a Waste of Time
  2. The Reason So Many Analytics Efforts Fall Short

— by Chris McShea, Dan Oakley and Chris Mazzei, all from EY.

 
[4]
 
No doubt φ can be shown to be a transcendental number that can be linked to π, e and i by some elegant formula.

Rather annoying φ is already the label we attach to the Golden Ratio, or (1 + √5)/2, but maybe I can repurpose this as I did π back in A quantised approach to formal group interactions of hominidae (size > 2).

 
[5]
 
Also see Ideas for avoiding Big Data failures and for dealing with them if they happen for the provenance of this misquote.
 
[6]
 
See also: A bad workman blames his [Business Intelligence] tools, which is as pertinent today as when I wrote it back in 2009.


From: peterjamesthomas.com, home of The Data and Analytics Dictionary

 

Predictions about Prediction

2017 the Road Ahead [Borrowed from Eckerson Group]

   
“Prediction and explanation are exactly symmetrical. Explanations are, in effect, predictions about what has happened; predictions are explanations about what’s going to happen.”

– John Rogers Searle


The above image is from Eckerson Group‘s article Predictions for 2017. Eckerson Group’s Founder and Principal Consultant, Wayne Eckerson (@weckerson), is someone whose ideas I have followed on-line for several years; indeed I’m rather surprised I have not posted about his work here before today.

As was possibly said by a variety of people, “prediction is very difficult, especially about the future” [1]. I did turn my hand to crystal ball gazing back in 2009 [2], but the Eckerson Group’s attempt at futurology is obviously much more up-to-date. As per my review of Bruno Aziza’s thoughts on the AtScale blog, I’m not going to cut and paste the text that Wayne and his associates have penned wholesale, instead I’d recommend reading the original article.

Here though are a number of points that caught my eye, together with some commentary of my own (the latter appears in italics below). I’ll split these into the same groups that Wayne & Co. use and also stick to their indexing, hence the occasional gaps in numbering. Where I have elided text, I trust that I have not changed the intended meaning:
 
 
Data Management

Data Management

1. The enterprise data marketplace becomes a priority. As companies begin to recognize the undesirable side effects of self-service they are looking for ways to reap self-service benefits without suffering the downside. […] The enterprise data marketplace returns us to the single-source vision that was once touted as the real benefit of Enterprise Data Warehouses.
  I’ve always thought of self-service as something of a cop-out. It tends to avoid data teams doing anything as arduous (and in some cases out of their comfort zone) as understanding what makes a business tick and getting to grips with the key questions that an organisation needs to answer in order to be successful [3]. With this messy and human-centric stuff out of the way, the data team can retreat into the comfort of nice orderly technological matters or friendly statistical models.

However, what Eckerson Group describe here is “an Amazon-like data marketplace”, which it seems to me has more of a chance of being successful. However, such a marketplace will only function if it embodies the same focus on key business questions and how they are answered. The paradigm within which such questions are framed may be different, more community based and more federated for example, but the questions will still be of paramount importance.

 
3.
 
New kinds of data governance organizations and practices emerge. Long-standing, command-and-control data governance practices fail to meet the challenges of big data and of data democratization. […]
  I think that this is overdue. To date Data Governance, where it is implemented at all, tends to be too police-like. I entirely agree that there are circumstances in which a Data Governance team or body needs to be able to put its foot down [4], but if all that Data Governance does is police-work, then it will ultimately fail. Instead good Data Governance needs to recognise that it is part of a much more fluid set of processes [5], whose aim is to add business value; to facilitate things being done as well as sometimes to stop the wrong path being taken.

 
Data Science

Data Science

1. Self-service and automated predictive analytics tools will cause some embarrassing mistakes. Business users now have the opportunity to use predictive models but they may not recognize the limits of the models themselves. […]
  I think this is a very valid point. As well as not understanding the limitations of some models [6], there is not widespread understanding of statistics in many areas of business. The concept of a central prediction surrounded by different outcomes with different probabilities is seldom seen in commercial circles [7]. In addition there seems to be a lack of appreciation of how big an impact the statistical methodology employed can have on what a model tells you [8].

 
Business Analytics

Business Analytics

1. Modern analytic platforms dominate BI. Business intelligence (BI) has evolved from purpose-built tools in the 1990s to BI suites in the 2000s to self-service visualization tools in the 2010s. Going forward, organizations will replace tools and suites with modern analytics platforms that support all modes of BI and all types of users […]
  Again, if it comes to fruition, such consolidation is overdue. Ideally the tools and technologies will blend into the background, good data-centric work is never about the technology and always about the content and the efforts involved in ensuring that it is relevant, accurate, consistent and timely [9]. Also information is often of most use when it is made available to people taking decisions at the precise point that they need it. This observation highlights the need for data to be integrated into systems and digital estates instead of simply being bound to an analytical hub.

 
So some food for thought from Wayne and his associates. The points they make (including those which I haven’t featured in this article) are serious and well-thought-out ones. It will be interesting to see how things have moved on by the beginning of 2018.


Notes

 
[1]
 
According to WikiQuotes, this has most famously been attributed to Danish theoretical physicist and father of Quantum Mechanics, Niels Bohr (in Teaching and Learning Elementary Social Studies (1970) by Arthur K. Ellis, p. 431). However it has also been ascribed to various humourists, the Danish poet Piet Hein: “det er svært at spå – især om fremtiden” and Danish cartoonist Storm P (Robert Storm Petersen). Perhaps it is best to say that a Dane made the comment and leave it at that.

Of course similar words have also been said to have been originated by Yogi Berra, but then that goes for most malapropisms you could care to mention. As Mr Berra himself says “I really didn’t say everything I said”.

 
[2]
 
See Trends in Business Intelligence. I have to say that several of these have come to pass, albeit sometimes in different ways to the ones I envisaged back then.
 
[3]
 
For a brief review of what is necessary see What should companies consider before investing in a Business Intelligence solution?
 
[4]
 
I wrote about the unpleasant side effects of a Change Programmes unfettered by appropriate Data Governance in Bumps in the Road, for example.
 
[5]
 
I describe such a set of processes in Data Management as part of the Data to Action Journey.
 
[6]
 
I explore some simmilar territory to that presented by Eckerson Group in Data Visualisation – A Scientific Treatment.
 
[7]
 
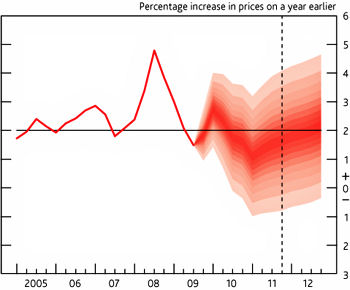
My favourite counterexample is provided by The Bank of England.

The Old Lady of Threadneedle Street is clearly not a witch
An inflation prediction from The Bank of England
Illustrating the fairly obvious fact that uncertainty increases in proportion to time from now.
 
[8]
 
This is an area I cover in An Inconvenient Truth.
 
[9]
 
I cover this assertion more fully in A bad workman blames his [Business Intelligence] tools.


Alphabet Soup

Alphabet soup

This article is about the latest consumer product from the Google stable, something which will revolutionise your eating experience by combining a chicken-broth base with a nanotechnology garnish and a soupçon of deep learning techniques to create a warming meal that also provides a gastro-intestinal health-check. Wait…

…I may have got my wires crossed a bit there. No, I mis-spoke, the article is actually about ever increasing number of CxO titles [1], which has made a roster of many organisations’ executives come to resemble a set of Scrabble tiles.

Specifically I will focus on two values of x, A and D, so the CAO and CDO roles [2]. What do these TLAs [3] stand for, what do people holding these positions do and can we actually prove that, for these purposes only, “A” ≡ “D”?
 
 
Breaking the Code

CDO & CAO

The starting position is not auspicious. What might CAO stand for? Existing roles that come to mind include: Chief Accounting Officer and Chief Administrative Officer. However, in our context, it actually stands for Chief Analytics Officer. There is no ISO definition of Analytics, as I note in one of my recent seminar decks [4] (quoting the Gartner IT Glossary, but with my underlining):

Analytics has emerged as a catch-all term for a variety of different business intelligence and application-related initiatives. In particular, BI vendors use the ‘analytics’ moniker to differentiate their products from the competition. Increasingly, ‘analytics’ is used to describe statistical and mathematical data analysis that clusters, segments, scores and predicts what scenarios are most likely to happen.

I should of course mention here that my current role incorporates the word “Analytics” [5], so I may be making a point against myself. But before I start channeling my 2009 article, Business Analytics vs Business Intelligence [6], I’ll perhaps instead move on to the second acronym. How to decode CDO? Well an equally recent translation would be Chief Digital Officer, but you also come across Chief Development Officer and sometimes even Chief Diversity Officer. Our meaning will however be Chief Data Officer. You can read about what I think a CDO does here.

A observation that is perhaps obvious to make at this juncture is that when the acronym of a role is not easy to pin down, the content of the role may be equally amorphous. It is probably fair to say that this is true of both CAO and CDO job descriptions. Both are emerging roles in the majority of organisations.
 
 
Before the Flood

HMS/USS* Chief Information Officer (* delete as applicable)

One thing that both roles have in common is that – in antediluvian days – their work used to be the province of another CxO, the CIO. This was before many CIOs became people who focus on solution architecture, manage relationships with outsourcers and have their time consumed by running Service Desks and heading off infrastructure issues [7]. Where organisations may have had just a CIO, they may well now have a CIO, a CAO and a CDO (and also a CTO perhaps which splits one original “C” role into four).

Aside from being a job creation scheme, the reasons for such splits are well-documented. The prevalence of outsourcing (and the complexity of managing such arrangements); the pervasiveness and criticality of technology leading to many CIOs focussing more on the care and feeding of systems than how businesses employ them; the relentless rise of Change organisations; and (frequently related to the last point) the increase in size of IT departments (particularly if staff in external partner organisations are included). All of these have pushed CIOs into more business as usual / back-room / engineering roles, leaving a vacuum in the nexus between business, technology and transformation. The fact that data processing is very different to data collation and synthesis has been another factor in CAOs and / or CDOs filling this vacuum.
 
 
Some other Points of View

James Taylor Robert Morison Jen Stirrup

As trailed in some previous articles [8], I have been thinking about the potential CAO / CDO dichotomy for some time. Towards the beginning of this period I read some notes that decision management luminary James Taylor had published based on the proceedings of the 2015 Chief Analytics Officer Summit. In the first part of these he cites comments made by Robert Morison as follows:

Practically speaking organizations need both roles [CAO and CDO] filled – either by one person or by two working closely together. This is hard because the roles are both new and evolving – role clarity was not the norm creating risk. In particular if both roles exist they must have some distinction such as demand v supply, offense v defense – adding value to data with analytics v managing data quality and consistency. But enterprises need to be ready – in particular when data is being identified as an asset by the CEO and executive team. CDOs tend to be driven by fragmented data environments, regulatory challenges, customer centricity. CAO tends to be driven by a focus on improving decision-making, moving to predictive analytics, focusing existing efforts.

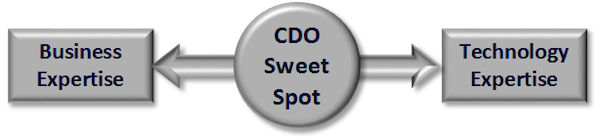
Where CAO and CDO roles are separate, the former tends to work on exploiting data, the latter on data foundations / compliance. These are precisely the two vertical extremities of the spectrum I highlighted in The Chief Data Officer “Sweet Spot”. As Robert points out, in order for both to be successful, the CAO and CDO need to collaborate very closely.

Around the same time, another take on the same general question was offered by Jen Stirrup in her 2015 PASS Diary [9] article, Why are PASS doing Business Analytics at all?. Here Jen cites the Gartner distinctions between descriptive, diagnostic, predictive and prescriptive analytics adding that:

Business Intelligence and Business Analytics are a continuum. Analytics is focused more on a forward motion of the data, and a focus on value.

Channeling Douglas Adams, this model can be rehashed as:

  1. What happened?
  2. Why did it happen?
  3. What is going to happen next?
  4. What should we be doing?

As well as providing a finer grain distinguishing different types of analytics, the steps necessary to answer these questions also tend to form a bridge between what might be regarded as definitively CDO work and what might be regarded as definitively CAO work. As Jen notes, it’s a continuum. Answering “What happened?” with any accuracy requires solid data foundations and decent data quality, working out “What is going to happen next?” requires each of solid data foundations, decent data quality and a statistical approach.
 
 
Much CDO about Nothing

Just an excuse to revist a happy ending for Wesley Wyndam-Pryce and Winifred Burkle - I'm such a fanboy :-o

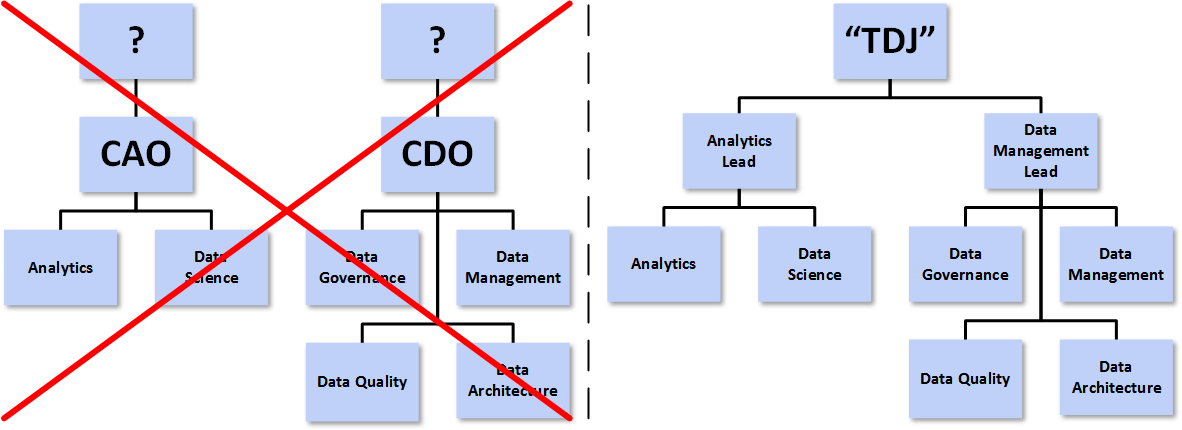
In some organisations, particularly the type where headcount is not a major factor in determining overall results, separate CAO and CDO departments can coexist; assuming of course that their leaders recognise their mutual dependency, park their egos at the door and get on with working together. However, even in such organisations, the question arises of to whom should the CAO and CDO report, a single person, two different people, or should one of them report to the other? In more cost-conscious organisations entirely separate departments may feel like something of a luxury.

My observation is that CAO staff generally end up doing data collation and cleansing, while CDO staff often get asked to provide data and carry out data analysis. This blurs what is already a fairly specious distinction between the two areas and provides scope for both duplication of work and – more worryingly – different answers to the same business questions. As I have mentioned in earlier articles, to anyone engaged in the fields, Analytics and Data Management are two sides of the same coin and both benefit from being part of the same unitary management structure.

Alignment of Data teams

If we consider the arrangements on the left-hand side of the above diagram, the two departments may end up collaborating, but the structure does not naturally lead to this. Indeed, where the priorities of the people that the CAO and CDO report in to differ, then there is scope for separate agendas, unhealthy competition and – again – duplication and waste. It is my assertion that the arrangements on the right-hand side are more likely to lead to a cohesive treatment of the spectrum of data matters and thus superior business outcomes.

In the right-hand exhibit, I have intentionally steered away from CAO and CDO titles. I recognise that there are different disciplines within the data world, but would expect virtual teams to form, disband and reform as required drawing on a variety of skills and experience. I have also indicated that the whole area should report into a single person, here given the monicker of TDJ (or Top Data Job [10]). You could of course map Analytics Lead to CAO and Data Management lead to CDO if you chose. Equally you could map one or other of these to the TDJ, with the other subservient. To an extent it doesn’t really matter. What I do think matters is that the TDJ goes to someone who understands the whole data arena; both the CAO and CDO perspectives. In my opinion this rules out most CEOs, COOs and CFOs from this role.
 
 
More or less Mandatory Sporting Analogy [11]

Association Football Free Kick

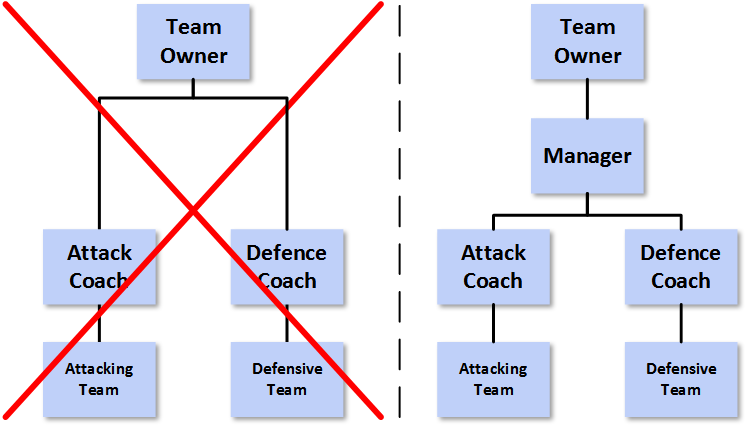
An analogy here comes from Robert Morison’s mention of “offense v defense” [12]. This puts me in mind of an [Association] Football Manager. In Soccer (to avoid further confusion), there are not separate offensive and defensive teams, whose presence on the field of play are mutually exclusive. Instead your defenders and attackers are different roles within one team; also sometimes defenders have to attack and attackers have to defend. The arrangements in the left-hand organogram are as if the defenders in a Soccer team were managed by one person, the attackers by another and yet they were all expected to play well together. Of course there are specialist coaches, but there is one Manager of a Soccer team who has overall accountability for tactics, selection and style of play (they also manage any specialist coaches). It is generally the Manager who lives or dies according to their team’s success. Equally, in the original right-hand organogram, if the TDJ is held by someone who understands just analytics or just data management, then it is like a Soccer Manager who only understands attack, but not defence.

The point I am trying to make is probably more readily apprehended via the following diagram:

Football-teams

On the assumption that the Manager on the right knows a lot about both attack and defence in Soccer, whereas the team owner is at best an interested amateur, then is the set up on the left or on the right likely to be a more formidable footballing force?

Even in American Football the analogy still holds. There are certainly offensive and defensive coaches, each of whom has “their” team on the park for a period. However, it is the Head Coach who calls the shots and this person needs to understand all of the nuances of the game.
 
 
In Closing

So, my recommendation is that – in data matters – you similarly have someone in the Top Data Job, with a broad knowledge of all aspects of data. They can be supported by specialists of course, but again someone needs to be accountable. To my mind, we already have a designation for such as person, a Chief Data Officer. However, to an extent this is semantics. A Chief Analytics Officer who is knowledgeable about Data Governance and Data Management could be the head data honcho [13], but one who only knows about analytics is likely to have their work cut out for them. Equally if CAO and CDO functions are wholly separate and only come together in an organisation under someone who has no background in data matters, then nothing but problems is going to arise.

The Top Data Job – or CDO in my parlance – has to be au fait with the span of data activities in an organisation and accountable for all work pertaining to data. If not then they will be as useful as a Soccer Manager who only knows about one aspect of the game and can only direct a handful of the 11 players on the field. Do organisations want some chance of winning the game, or to tie their hands behind their backs and don a blindfold before engaging in data activities? The choice should not really be a difficult one.


Notes

 
[1]
 
x : 65 ≤ ascii(x) ≤ 90.
 
[2]
 
“C”, “A”, “O” + “C”, “D”, “O” + (for no real reason save expediency) “R” allows you to spell ACCORD, which scores 11 in Executive Scrabble.
 
[3]
 
Three Letter Acronyms.
 
[4]
 
Data Management, Analytics, People: An Eternal Golden Braid – A Metaphorical Fugue On The Data ⇒ Information ⇒ Insight ⇒ Action Journey In The Spirit Of Douglas R. HofstadterIRM(UK) Enterprise Data / Business Intelligence 2016
 
[5]
 
I hasten to add that it also contains the phrase “Data Management” – see here.
 
[6]
 
Probably not a great idea for any of those involved.
 
[7]
 
Whether or not this evolution (or indeed regression) of the CIO role has proved to be a good thing is perhaps best handled in a separate article.
 
[8]
 
Including:

  1. Wanted – Chief Data Officer
  2. 5 Themes from a Chief Data Officer Forum
  3. 5 More Themes from a Chief Data Officer Forum and
  4. The Chief Data Officer “Sweet Spot”
 
[9]
 
PASS was co-founded by CA Technologies and Microsoft Corporation in 1999 to promote and educate SQL Server users around the world. Since its founding, PASS has expanded globally and diversified its membership to embrace professionals using any Microsoft data technology.
 
[10]
 
With acknowledgement to Peter Aiken.
 
[11]
 
A list of my articles that employ sporting analogies appears – appropriately enough – at the beginning of Analogies.
 
[12]
 
That’s “offence vs defence” in case any readers were struggling.
 
[13]
 
Maybe organisations should consider adding HDH to their already very crowded Executive alphabet soup.


The Chief Data Officer “Sweet Spot”

CDO "sweet spot"

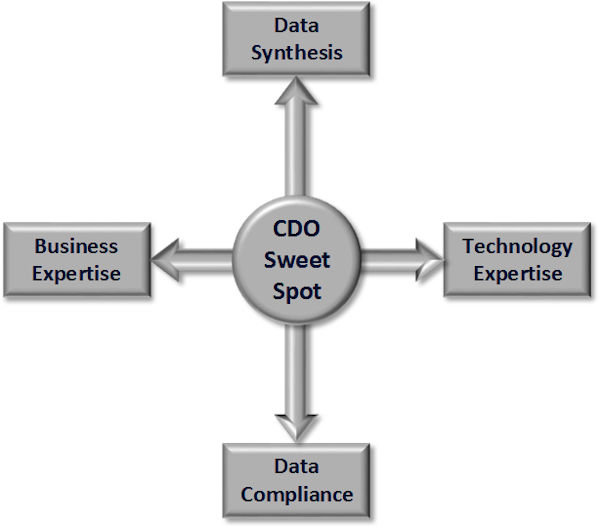
I verbally “scribbled” something quite like the exhibit above recently in conversation with a longstanding professional associate. This was while we were discussing where the CDO role currently sat in some organisations and his or her span of responsibilities. We agreed that – at least in some cases – the role was defined sub-optimally with reference to the axes in my virtual diagram.

This discussion reminded me that I was overdue a piece commenting on November’s IRM(UK) CDO Executive Forum; the third in a sequence that I have covered in these pages [1], [2]. In previous CDO Exec Forum articles, I have focussed mainly on the content of the day’s discussions. Here I’m going to be more general and bring in themes from the parent event; IRM(UK) Enterprise Data / Business Intelligence 2016. However I will later return to a theme central to the Exec Forum itself; the one that is captured in the graphic at the head of this article.

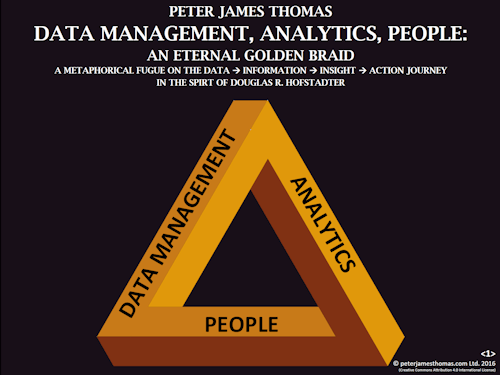
As well as attending the CDO Forum, I was speaking at the umbrella event. The title of my talk was Data Management, Analytics, People: An Eternal Golden Braid [3].

Data Management, Analytics, People: An Eternal Golden Braid

The real book, whose title I had plagiarised, is Gödel, Escher and Bach, an Eternal Golden braid, by Pulitzer-winning American Author and doyen of 1970s pop-science books, Douglas R. Hofstadter [4]. This book, which I read in my youth, explores concepts in consciousness, both organic and machine-based, and their relation to recursion and self-reference. The author argued that these themes were major elements of the work of each of Austrian Mathematician Kurt Gödel (best known for his two incompleteness theorems), Dutch graphic artist Maurits Cornelis Escher (whose almost plausible, but nevertheless impossible buildings and constantly metamorphosing shapes adorn both art galleries and college dorms alike) and German composer Johann Sebastian Bach (revered for both the beauty and mathematical elegance of his pieces, particularly those for keyboard instruments). In an age where Machine Learning and other Artificial Intelligence techniques are moving into the mainstream – or at least on to our Smartphones – I’d recommend this book to anyone who has not had the pleasure of reading it.

In my talk, I didn’t get into anything as metaphysical as Hofstadter’s essays that intertwine patterns in Mathematics, Art and Music, but maybe some of the spirit of his book rubbed off on my much lesser musings. In any case, I felt that my session was well-received and one particular piece of post-presentation validation had me feeling rather like these guys for the rest of the day:

The cast and author / director of Serenity at Comic Con

What happened was that a longstanding internet contact [5] sought me out and commended me on both my talk and the prescience of my July 2009 article, Is the time ripe for appointing a Chief Business Intelligence Officer? He argued convincingly that this foreshadowed the emergence of the Chief Data Officer. While it is an inconvenient truth that Visa International had a CDO eight years earlier than my article appeared, on re-reading it, I was forced to acknowledge that there was some truth in his assertion.

To return to the matter in hand, one point that I made during my talk was that Analytics and Data Management are two sides of the same coin and that both benefit from being part of the same unitary management structure. By this I mean each area reporting into an Executive who has a strong grasp of what they do, rather than to a general manager. More specifically, I would see Data Compliance work and Data Synthesis work each being the responsibility of a CDO who has experience in both areas.

It may seem that crafting and implementing data policies is a million miles from data visualisation and machine learning, but to anyone with a background in the field, they are much more strongly related. Indeed, if managed well (which is often the main issue), they should be mutually reinforcing. Thus an insightful model can support business decision-making, but its authors would generally be well-advised to point out any areas in which their work could be improved by better data quality. Efforts to achieve the latter then both improve the usefulness of the model and help make the case for further work on data remediation; a virtuous circle.

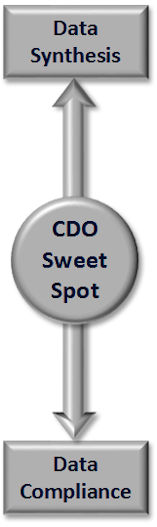
CDO "sweet spot" vertical axis

Here we get back to the vertical axis in my initial diagram. In many organisations, the CDO can find him or herself at the extremities. Particularly in Financial Services, an industry which has been exposed to more new regulation than many in recent years, it is not unusual for CDOs to have a Risk or Compliance background. While this is very helpful in areas such as Governance, it is less of an asset when looking to leverage data to drive commercial advantage.

Symmetrically, if a rookie CDO was a Data Scientist who then progressed to running teams of Data Scientists, they will have a wealth of detailed knowledge to fall back on when looking to guide business decisions, but less familiarity with the – sometimes apparently thankless, and generally very arduous – task of sorting out problems in data landscapes.

Despite this, it is not uncommon to see CDOs who have a background in just one of these two complementary areas. If this is the case, then the analytics expert will have to learn bureaucratic and programme skills as quickly as they can and the governance guru will need to expand their horizons to understand the basics of statistical modelling and the presentation of information in easily digestible formats. It is probably fair to say that the journey to the centre is somewhat perilous when either extremity is the starting point.

CDO "sweet spot" vertical axis

Let’s now think about the second and horizontal axis. In some organisations, a newly appointed CDO will be freshly emerged from the ranks of IT (in some they may still report to the CIO, though this is becoming more of an anomaly with each passing year). As someone whose heritage is in IT (though also from very early on with a commercial dimension) I understand that there are benefits to such a career path, not least an in-depth understanding of at least some of the technologies employed, or that need to be employed. However a technology master who is also a business neophyte is unlikely to set the world alight as a newly-minted CDO. Such people will need to acquire new skills, but the learning curve is steep.

To consider the other extreme of this axis, it is undeniable that a CDO organisation will need to undertake both technical and technological work (or at least to guide this in other departments). Therefore, while an in-depth understanding of a business, its products, markets, customers and competitors will be of great advantage to a new CDO, without at least a reasonable degree of technical knowledge, they may struggle to connect with some members of their team; they may not be able to immediately grasp what technology tasks are essential and which are not; and they may not be able to paint an accurate picture of what good looks like in the data arena. Once more rapid assimilation of new information and equally rapid acquisition of new skills will be called for.

I couldn't find a good image of a cricket bat and so this will have to do

At this point it will be pretty obvious that my central point here is that the “sweet spot” for a CDO, the place where they can have greatest impact on an organisation and deliver the greatest value, is at the centre point of both of these axes. When I was talking to my friend about this, we agreed that one of the reasons why not many CDOs sit precisely at this nexus is because there are few people with equal (or at least balanced) expertise in the business and technology fields; few people who understand both data synthesis and data compliance equally well; and vanishingly few who sit in the centre of both of these ranges.

Perhaps these facts would also have been apparent from revewing the CDO job description I posted back in November 2015 as part of Wanted – Chief Data Officer. However, as always, a picture paints a thousand words and I rather like the compass-like exhibit I have come up with. Hopefully it conveys a similar message more rapidly and more viscerally.

To bring things back to the IRM(UK) CDO Executive Forum, I felt that issues around where delegates sat on my CDO “sweet spot” diagram (or more pertinently where they felt that they should sit) were a sub-text to many of our discussions. It is worth recalling that the mainstream CDO is still an emergent role and a degree of confusion around what they do, how they do it and where they sit in organisations is inevitable. All CxO roles (with the possible exception of the CEO) have gone through similar journeys. It is probably instructive to contrast the duties of a Chief Risk Officer before 2008 with the nature and scope of their responsibilities now. It is my opinion that the CDO role (and individual CDOs) will travel an analogous path and eventually also settle down to a generally accepted set of accountabilities.

In the meantime, if your organisation is lucky enough to have hired one of the small band of people whose experience and expertise already place them in the CDO “sweet spot”, then you are indeed fortunate. If not, then not all is lost, but be prepared for your new CDO to do a lot of learning on the job before they too can join the rather exclusive club of fully rounded CDOs.


Epilogue

As an erstwhile Mathematician, I’ve never seen a framework that I didn’t want to generalise. It occurs to me and – I assume – will also occur to many readers that the North / South and East / West diagram I have created could be made even more compass-like by the addition of North East / South West and North West / South East axes, with our idealised CDO sitting in the middle of these spectra as well [6].

Readers can debate amongst themselves what the extremities of these other dimensions might be. I’ll suggest just a couple: “Change” and “Business as Usual”. Given how organisations seem to have evolved in recent years, it is often unfortunately a case of never the twain shall meet with these two areas. However a good CDO will need to be adept at both and, from personal experience, I would argue that mastery of one does not exclude mastery of the other.


 Notes

 
[1]
 
See each of:

 
[2]
 
The main reasons for delay were a house move and a succession of illnesses in my family – me included – so I’m going to give myself a pass.
 
[3]
 
The sub-title was A Metaphorical Fugue On The Data ⇨ Information ⇨ Insight ⇨ Action Journey in The Spirt Of Douglas R. Hofstadter, which points to the inspiration behind my talk rather more explicity.
 
[4]
 
Douglas R. Hofstadter is the son of Nobel-wining physicist Robert Hofstadter. Prize-winning clearly runs in the Hofstadter family, much as with the Braggs, Bohrs, Curies, Euler-Chelpins, Kornbergs, Siegbahns, Tinbergens and Thomsons.
 
[5]
 
I am omitting any names or other references to save his blushes.
 
[6]
 
I could have gone for three or four dimensional Cartesian coordinates as well I realise, but sometimes (very rarely it has to be said) you can have too much Mathematics.


5 More Themes from a Chief Data Officer Forum

A rather famous theme

This article is the second of two pieces reflecting on the emerging role of the Chief Data Officer. Each article covers 5 themes. You can read the first five themes here.

As with the first article, I would like to thank both Peter Aiken, who reviewed a first draft of this piece and provided useful clarifications and additional insights, and several of my fellow delegates, who also made helpful suggestions around the text. Again any errors of course remain my responsibility.
 
 
Introduction Redux

After reviewing a draft of the first article in this series and also scanning an outline of this piece, one of the other attendees at the inaugural IRM(UK) / DAMA CDO Executive Forum rightly highlighted that I had not really emphasised the strategic aspects of the CDO’s work; both data / information strategy and the close linkage to business strategy. I think the reason for this is that I spend so much of my time on strategic work that I’ve internalised the area. However, I’ve come to the not unreasonable conclusion that internalisation doesn’t work so well on a blog, so I will call out this area up-front (as well as touching on it again in Theme 10 below).

For more of my views on strategy formation in the data / information space please see my trilogy of articles starting with: Forming an Information Strategy: Part I – General Strategy.

With that said, I’ll pick up where we left off with the themes that arose in the meeting: 
 
Theme 6 – While some CDO roles have their genesis in risk mitigation, most are focussed on growth

Epidermal growth factor receptor

This theme gets to the CDO / CAO debate (which I will be writing about soon). It is true that the often poor state of data governance in organisations is one reason why the CDO role has emerged and also that a lot of CDO focus is inevitably on this area. The regulatory hurdles faced by many industries (e.g. Solvency II in my current area of Insurance) also bring a significant focus on compliance to the CDO role. However, in the unanimous view of the delegates, while cleaning the Augean Stables is important and equally organisations which fail to comply with regulatory requirements tend to have poor prospects, most CDOs have a growth-focussed agenda. Their primary objective is to leverage data (or to facilitate its leverage) to drive growth and open up new opportunities. Of course good data management is a prerequisite for achieving this objective in a sustainable manner, but it is not an end in itself. Any CDO who allows themself to be overwhelmed by what should just be part of their role is probably heading in the same direction as a non-compliant company.
 
 
Theme 7 – New paradigms are data / analytics-centric not application-centric

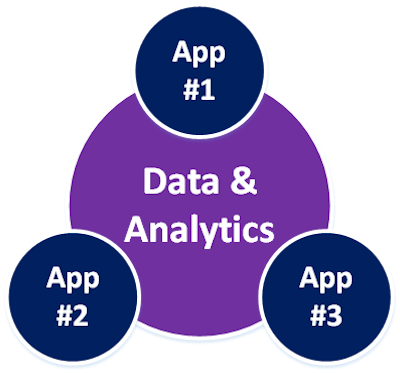
Applications & Data

Historically, technology landscapes used to be application-centric. Often there would be a cluster of systems in the centre (ideally integrated with each other in some way) and each with their own analytics capabilities; a CRM system with customer analytics “out-of-the-box” (whatever that really means in practice), an ERP system with finance analytics and maybe supply-chain analytics, digital estates with web analytics and so on. Even if there was a single-central system (those of us old enough will still remember the ERP vision), then this would tend to have various analytical repositories around it used by different parts of the organisation for different purposes. Equally some of the enterprise data warehouses I have built have included specialist analytical repositories, e.g. to support pricing, or risk, or other areas.

Today a new paradigm is emerging. Under this, rather than being at the periphery, data and analytics are in the centre, operating in a more joined-up manner. Many companies have already banked the automation and standardisation benefits of technology and are now looking instead to exploit the (often considerably larger) information and insight benefits [1]. This places information and insight assets at the centre of the landscape. It also means that finally information needs can start to drive system design and selection, not the other way round.
 
 
Theme 8 – Data and Information need to be managed together

Data and Information in harness

We see a further parallel with the CAO vs CDO debate here [2]. After 27 years with at least one foot in IT (though often in hybrid roles with dual business / IT reporting) and 15 explicitly in the data and information space, I really fail to see how data and information are anything other than two sides of the same coin.

To people who say that the CAO is the one who really understands the business and the CDO worries instead about back-end data governance, I would reply that an engine is only as good as the fuel that you put into it. I’d over-extend the analogy (as is my wont [3]) by saying that the best engineers will have a thorough understanding of:

  1. what purpose the engine will be applied to – racing car, or lorry (truck)
  2. the parameters within which it is required to perform
  3. the actual performance requirements
  4. what that means in terms of designing the engine
  5. what inputs the engine will have: petrol/diesel/bio-fuel/electricity
  6. what outputs it will produce (with no reference to poor old Volkswagen intended)

It may be that the engineering team has experts in various areas from metallurgy, to electronics, to chemistry, to machining, to quality control, to noise and vibration suppression, to safety, to general materials science and that these are required to work together. But whoever is in charge of overall design, and indeed overall production, would need to have knowledge spanning all these areas and would in addition need to ensure that specialists under their supervision worked harmoniously together to get the best result.

Data is the basic building block of information. Information is the embodiment of things that people want or need to know. You cannot generate information (let alone insight) without a very strong understanding of data. You can neither govern, nor exploit, data in any useful way without knowledge of the uses to which it will be put. Like the chief product engineer, there is a need for someone who understands all of the elements, all of the experts working on these and can bring them together just as harmoniously [4]).
 
 
Theme 9 – Data Science is not enough

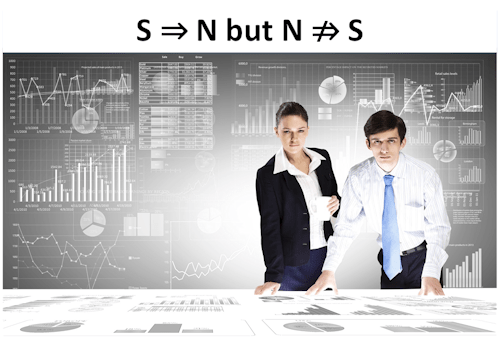
If you don't understand  the notation, you've failed in your application to be a  Data Scientist

In Part One of this article I repeated an assertion about the typical productivity of data scientists:

“Data Scientists are only 10-20% productive; if you start a week-long piece of work on Monday, the actual statistical analysis will commence on Friday afternoon; the rest of the time is battling with the data”

While the many data scientists I know would attest to the truth of this, there is a broader point to be made. That is the need for what can be described as Data Interpreters. This role is complementary to the data science community, acting as an interface between those with PhDs in statistics and the rest of the world. At IRM(UK) ED&BI one speaker even went so far as to present a photo graph of two ladies who filled these ying and yang roles at a European organisation.

More broadly, the advent of data science, while welcome, has not obviated the need to pass from data through information to get to insight for most of an organisation’s normal measurements. Of course an ability to go straight from data to insight is also a valuable tool, but it is not suitable for all situations. There are also a number of things to be aware of before uncritically placing full reliance on statistical models [5].
 
 
Theme 10 – Information is often a missing link between Business and IT strategies

Business => Information => IT

This was one of the most interesting topics of discussion at the forum and we devoted substantial time to exploring issues and opportunities in this area. The general sense was that – as all agreed – IT strategy needs to be aligned with business strategy [6]. However, there was also agreement that this can be hard and in many ways is getting harder. With IT leaders nowadays often consumed by the need to stay abreast of both technology opportunities (e.g. cloud computing) and technology threats (e.g. cyber crime) as well as inevitably having both extensive business as usual responsibilities and significant technology transformation programmes to run, it could be argued that some IT departments are drifting away from their business partners; not through any desire to do so, but just because of the nature (and volume) of current work. Equally with the increasing pace of business change, few non-IT executives can spend as much time understanding the role of technology as was once perhaps the case.

Given that successful information work must have a foot in both the business and technology camps (“what do we want to do with our data?” and “what data do we have available to work with?” being just two pertinent questions), the argument here was that an information strategy can help to build a bridge these two increasingly different worlds. Of course this chimes with the feedback on the primacy of strategy that I got on my earlier article from another delegate; and which I reference at the beginning of this piece. It also is consistent with my own view that the data → information → insight → action journey is becoming an increasingly business-focused one.

A couple of CDO Forum delegates had already been thinking about this area and went so far as to present models pertaining to a potential linkage, which they had either created or adapted from academic journals. These placed information between business and IT pillars not just with respect to strategy but also architecture and implementation. This is a very interesting area and one which I hope to return to in coming weeks.
 
 
Concluding thoughts

As I mentioned in Part One, the CDO Forum was an extremely useful and thought-provoking event. One thing which was of note is that – despite the delegates coming from many different backgrounds, something which one might assume would be a barrier to effective communication – they shared a common language, many values and comparable views on how to take the areas of data management and data exploitation forward. While of course delegates at an such an eponymous Forum might be expected to emphasise the importance of their position, it was illuminating to learn just how seriously a variety organisations were taking the CDO role and that CDOs were increasingly becoming agents of growth rather than just risk and compliance tsars.

Amongst the many other themes captured in this piece and its predecessor, perhaps a stand-out was how many organisations view the CDO as a firmly commercial / strategic role. This can only be a positive development and my hope is that CDOs can begin to help organisations to better understand the asset that their data represents and then start the process of leveraging this to unlock its substantial, but often latent, business value.


Notes

 
[1]
 
See Measuring the benefits of Business Intelligence
 
[2]
 
Someone really ought to write an article about that!

UPDATE: They now have in: The Chief Data Officer “Sweet Spot” and Alphabet Soup

 
[3]
 
See Analogies for some further examples as well as some of the pitfalls inherent in such an approach.
 
[4]
 
I cover this duality in many places in this blog, for the reader who would like to learn more about my perspectives on the area, A bad workman blames his [Business Intelligence] tools is probably a good place to start; this links to various other resources on this site.
 
[5]
 
I cover some of these here, including (in reverse chronological order):

 
[6]
 
I tend to be allergic to the IT / Business schism as per: Business is from Mars and IT is from Venus (incidentally the first substantive article on I wrote for this site), but at least it serves some purpose in this discussion, rather than leading to unproductive “them and us” syndrome, that is sadly all to often the outcome.


5 Themes from a Chief Data Officer Forum

A rather famous theme

This article is the first of two pieces reflecting on the emerging role of the Chief Data Officer. Each article will cover 5 themes and the concluding chapter may be viewed here.

I would like to thank both Peter Aiken, who reviewed a first draft of this piece and provided useful clarifications and additional insights, and several of my fellow delegates, who also made helpful suggestions around the text. Any errors of course remain my responsibility.
 
 
Introduction

As previously trailed, I attended the IRM(UK) Enterprise Data & Business Intelligence seminar on 3rd and 4th November. On the first of these days I sat on a panel talking about approaches to leveraging data “beyond the Big Data hype”. This involved fielding some interesting questions, both from the Moderator – Mike Simons – and the audience; I’ll look to pen something around a few of these in coming days. It was also salutary that each one of the panellists cast themselves as sceptics with respect to Big Data (the word “Luddite” was first discussed as an appropriate description, only to then be discarded); feeling that it was a very promising technology but a long way from the universal panacea it is often touted to be.

However it is on the second day of the event that I wanted to focus in this article. During this I was asked to attend the inaugural Chief Data Officer Executive Forum, sponsored by long-term IRM partner DAMA, the international data management association. This day-long event was chaired by data management luminary Peter Aiken, Associate Professor of Information Systems at Virginia Commonwealth University and Founding Director of data management consultancy Data Blueprint.

The forum consisted of a small group of people working in the strongly-related arenas of data management, data governance, analytics, warehousing and information architecture. Some attendees formally held the title of CDO, some carried out functions overlapping or analogous to the CDO. This is probably not surprising given the emergent nature of the CDO role in many industries.

There was a fair mix of delegate backgrounds, including people who previously held commercial roles, or ones in each of finance, risk and technology (a spread that I referred to in my pre-conference article). The sectors attendees worked in ranged from banking, to manufacturing, to extractives, to government to insurance. A handful of DAMA officers made up the final bakers’ dozen of “wise men” [1].

Discussions were both wide-ranging and very open, so I am not going to go into specifics of what people said, or indeed catalogue the delegates or their organisations. However, I did want to touch on some of the themes which arose from our interchanges and I will leaven these with points made in Peter Aiken’s excellent keynote address, which started the day in the best possible way.
 
 
Theme 1 – Chief Data Officer is a full-time job

Not a part-time activity

In my experience in business, things happen when an Executive is accountable for them and things languish when either a committee looks at an area (= no accountability), or the work receives only middle-management attention (= no authority). If both being a guardian of an organisation’s data (governance) and caring about how this is leveraged to deliver value (exploitation) are important things, then they merit Executive ownership.

Equally it can be tempting to throw the data and information agenda to an existing Executive, maybe one who already plays in the information arena such as the CFO. The problem with this is that I don’t know many CFOs who have a lot of spare time. They tend to have many priorities already. Let’s say that your average CFO has 20 main things that they worry about. When they add data and information to this mix, then let’s be optimistic and say this slots in at number 15. Is this really going to lead to paradigm-shifting work on data exploitation or data governance?

For most organisations the combination of Data Governance and Data Exploitation is a huge responsibility in terms of both scope and complexity. It is not work to be approached lightly and definitively not territory where a part-timer will thrive.

Peter Aiken also emphasizes that a newly appointed CDO may well find him or herself looking to remediate years of neglect for areas such as data management. The need to address such issues suggests that focus is required.

To turn things round, how many organisations of at least a reasonable size have one of their executives act as CFO on a part time basis?
 
 
Theme 2 – The CDO most logically reports into a commercial area (CEO or COO)

Where does the CDO fit?

I’d echo Peter Aiken’s comments that IT departments and the CIOs who lead them have achieved great things in the past decades (I’ve often been part of the teams doing just this). However today (often as a result of just such successes) the CIO’s remit is vast. Even just care and feeding of the average organisation’s IT estate is a massive responsibility. If you add in typical transformation programmes as well, it is easy to see why most CIOs are extremely busy.

Another interesting observation is that the IT project mindset – while wholly suitable for the development, purchase and integration of transaction processing systems – is less aligned with data-centric work. This is because data evolves. Peter Aiken also talks about data operating at a different cadence, by which he means the flow or rhythm of events, especially the pattern in which something is experienced.

More prosaically, anyone who has seen the impact of a set of parallel and uncoordinated projects on a previously well-designed data warehouse will be able to attest to the project and asset mindsets not mingling too well in the information arena. Also, unlike much IT work, data-centric activities are not always ones that can be characterised by having a beginning, middle and end; then tend to be somewhat more open ended as an organisation’s data seldom is static and its information needs have similar dynamism.

Instead, the exploitation of an organisation’s data is essentially a commercial exercise which is 100% targeted at better business decision making. This work should be focussed on adding value (see also Theme 5 below). Both of these facts argue for the responsible function reporting outside of IT (but obviously with a very strong technical flavour). Logical reporting lines are thus into either the CEO or COO, assuming that the latter is charged with the day-to-day operations of the business [2].
 
 
Theme 3 – The span of CDO responsibilities is still evolving

Answers on a postcard...

While there are examples of CDOs being appointed in the early 2000s, the role has really only recently impinged on the collective corporate consciousness. To an extent, many organisations have struggled with the data → information → insight → action journey, so it is unsurprising that the precise role of the CDO is at present not entirely clear. Is CDO a governance-focussed role, or an information-generating role, or both? How does a CDO relate to a Chief Analytics Officer, or are they the same thing? [3]

It is evident that there is some confusion here. On the assumption (see Theme 2 above) that the CDO sits outside IT, then how does it relate to IT and where should data-centric development resource be deployed? How does the CDO relate to compliance and risk? [4]

The other way of looking at this is that there is a massive opportunity for embryonic CDOs to define their function and span of control. We have had CFOs and their equivalents for centuries (longer if you go back to early Babylonian Accounting), how exciting would it be to frame the role and responsibilities of an entirely new C-level executive?
 
 
Theme 4 – Data Management is an indispensable foundation for Analytics, Visualisation and Statistical Modelling

Look out for vases containing scorpions...

Having been somewhat discursive on the previous themes, here I will be brief. I’ve previously argued that a picture paints a thousand words [5] and here I’ll simply include my poor attempt at replicating an exhibit that I have borrowed from Peter Aiken’s deck. I think it speaks for itself:

Data Governance Triangle

You can view Peter’s original, which I now realise diverges rather a lot from my attempt to reproduce it, here.

I’ll close this section by quoting a statistic from the plenary sessions of the seminar: “Data Scientists are only 10-20% productive; if you start a week-long piece of work on Monday, the actual statistical analysis will commence on Friday afternoon; the rest of the time is battling with the data” [6].

CDOs should be focussed on increasing the productivity of all staff (Data Scientists included) by attending to necessary foundational work in the various areas highlighted in the exhibit above.
 
 
Theme 5 – The CDO is in the business of driving cultural change, not delivering shiny toys

When there's something weird on your board of dash / When there's something weird and it's kinda crass / Who you gonna call?

While all delegates agreed that a CDO needs to deliver business value, a distinction was made between style and substance. As an example, Big Data is a technology – an exciting one which allows us to do things we have not done before, but still a technology. It needs to be supported and rounded out by attention to process and people. The CDO should be concerned about all three of these dimensions (see also Theme 4 above).

I mentioned at the beginning of this article that some of the attendees at the CDO forum hailed from the extractive industries. We had some excellent discussions about how safety has been embedded in the culture of such organisations. But we also spoke about just how long this has taken and how much effort was required to bring about the shift in mindset. As always, changing human behaviour is not a simple or quick thing. If one goal of a CDO is to embed reliance on credible information (including robust statistical models) into an organisation’s DNA, then early progress is not to be anticipated; instead the CDO should be dug in for the long-term and have vast reserves of perseverance.

As regular readers will be unsurprised to learn, I’m delighted with this perspective. Indeed tranches of this blog are devoted precisely to the important area [7]. I am also somewhat allergic to a focus on fripperies at the expense of substance, something I discussed most directly in “All that glisters is not gold” – some thoughts on dashboards. These perspectives seem to be well-aligned with the stances being adopted by many CDOs.

As with any form of change, the group unanimously felt that good communication lay at the heart of success. A good CDO needs to be a consummate communicator.
 
 
Tune in next time…

I have hopefully already given some sense of the span of topics the CDO Executive Forum discussed. The final article in this short series covers a further 5 themes and then look to link these together with some more general conclusions about what a CDO should do and how they should do it.


Notes

 
[1]
 
Somewhat encouragingly three of these were actually wise women, then maybe I am setting the bar too low!
 
[2]
 
Though if reporting to a COO, the CDO will need to make sure that they stay close to wherever business strategy is developed; perhaps the CEO, perhaps a senior strategy or marketing executive.
 
[3]
 
I plan to write on the CDO / CAO dichotomy in coming weeks.

UPDATE: I guess it took more than a few weeks, but now see: The Chief Data Officer “Sweet Spot” and Alphabet Soup

 
[4]
 
I will expand on this area in Theme 6, which will be part of the second article in this series.
 
[5]
 
I actually have the cardinality wrong here as per my earlier article.
 
[6]
 
I will return to this point in Theme 9, which again will be part of the second article in the series.
 
[7]
 
A list of articles about cultural change in the context of information programmes may be viewed here.


An Inconvenient Truth

Frequentists vs. Bayesians - © xkcd.com
© xkcd.com (adapted from the original to fit the dimensions of this page)

No, not a polemic about climate change, but instead some observations on the influence of statistical methods on statistical findings. It is clearly a truism to state that there are multiple ways to skin a cat, what is perhaps less well-understood is that not all methods of flaying will end up with a cutaneously-challenged feline and some may result in something altogether different.

So an opaque introduction, let me try to shed some light instead. While the points I am going to make here are ones that any statistical practitioner would (or certainly should) know well, they are perhaps less widely appreciated by a general audience. I returned to thinking about this area based on an article by Raphael Silberzahn and Eric Uhlmann in Nature [1], but one which I have to admit first came to my attention via The Economist [2].

Messrs Silberzahn and Uhlmann were propounding a crowd-sourced approach to statistical analysis in science, in particular the exchange of ideas about a given analysis between (potentially rival) groups before conclusions are reached and long before the customary pre- and post-publication reviews. While this idea may well have a lot of merit, I’m instead going to focus on the experiment that the authors performed, some of its results and their implications for more business-focussed analysis teams and individuals.

The interesting idea here was that Silberzahn and Uhlmann provided 29 different teams of researchers the same data set and asked them to investigate the same question. The data set was a sporting one covering the number of times that footballers (association in this case, not American) were dismissed from the field of play by an official. The data set included many attributes from the role of the player, to when the same player / official encountered each other, to demographics of the players themselves. The question was – do players with darker skins get dismissed more often than their fairer teammates?

Leaving aside the socio-political aspects that this problem brings to mind, the question is one that, at least on first glance, looks as if it should be readily susceptible to statistical analysis and indeed the various researchers began to develop their models and tests. A variety of methodologies was employed, “everything from Bayesian clustering to logistic regression and linear modelling” (the authors catalogued the approaches as well as the results) and clearly each team took decisions as to which data attributes were the most significant and how their analyses would be parameterised. Silberzahn and Uhlmann then compared the results.

Below I’ll simply repeat part of their comments (with my highlighting):

Of the 29 teams, 20 found a statistically significant correlation between skin colour and red cards […]. The median result was that dark-skinned players were 1.3 times more likely than light-skinned players to receive red cards. But findings varied enormously, from a slight (and non-significant) tendency for referees to give more red cards to light-skinned players to a strong trend of giving more red cards to dark-skinned players.

This diversity in findings is neatly summarised in the following graph (please click to view the original on Nature’s site):

Nature Graph

© NPG. Used under license 3741390447060 Copyright Clearance Center

To be clear here, the unanimity of findings that one might have expected from analysing what is essentially a pretty robust and conceptually simple data set was essentially absent. What does this mean aside from potentially explaining some of the issues with repeatability that have plagued some parts of science in recent years?

Well the central observation is that precisely the same data set can lead to wildly different insights dependent on how it is analysed. It is not necessarily the case that one method is right and others wrong, indeed in review of the experiment, the various research teams agreed that the approaches taken by others were also valid. Instead it is extremely difficult to disentangle results from the algorithms employed to derive them. In this case methodology had a bigger impact on findings than any message lying hidden in the data.

Here we are talking about leading scientific researchers, whose prowess in statistics is a core competency. Let’s now return to the more quotidian world of the humble data scientist engaged in helping an organisation to take better decisions through statistical modelling. Well the same observations apply. In many cases, insight will be strongly correlated with how the analysis is performed and the choices that the analyst has made. Also, it may not be that there is some objective truth hidden in a dataset, instead only a variety of interpretations of this.

Now this sounds like a call to abandon all statistical models. Nothing could be further from my point of view [3]. However caution is required. In particular those senior business people who place reliance on the output of models, but who maybe do not have a background in statistics, should perhaps ask themselves whether what their organisation’s models tell them is absolute truth, or instead simply more of an indication. They should also ask whether a different analysis methodology might have yielded a different result and thus dictated different business action.

At the risk of coming over all Marvel, the great power of statistical modelling comes with great responsibility.

In 27 years in general IT and 15 in the data/information space (to say nothing of my earlier Mathematical background) I have not yet come across a silver bullet. My strong suspicion is that they don’t exist. However, I’d need to carry out some further analysis to reach a definitive conclusion; now what methodology to employ…?


Notes

 
[1]
 
Crowdsourced research: Many hands make tight work. Raphael Silberzahn &a Eric L. Uhlmann. Nature. 07 October 2015.
07 October 2015
 
[2]
 
On the other hands – Honest disagreement about methods may explain irreproducible results.The Economist 10th Oct 2015.
 
[3]
 
See the final part of my trilogy on using historical data to justify BI investments for a better representation of my actual views.