An expanded and more mobile-friendly version of the Data & Analytics Dictionary

The Data and Analytics Dictionary

A revised and expanded version of the peterjamesthomas.com Data and Analytics Dictionary has been published.

Mobile version of The Data & Analytics Dictionary (yes I have an iPhone 6s in 2020, please don't judge me!)

The previous Dictionary was not the easiest to read on mobile devices. Because of this, the layout has been amended in this release and the mobile experience should now be greatly enhanced. Any feedback on usability would be welcome.

The new Dictionary includes 22 additional definitions, bringing the total number of entries to 220, totalling well over twenty thousand words. As usual, the new definitions range across the data arena: from Data Science and Machine Learning; to Information and Reporting; to Data Governance and Controls. They are as follows:

  1. Analysis Facility
  2. Analytical Repository
  3. Boosting [Machine Learning]
  4. Conformed Data (Conformed Dimension)
  5. Data Capability
  6. Data Capability Framework (Data Capability Model)
  7. Data Capability Review (Data Capability Assessment)
  8. Data Driven
  9. Data Governance Framework
  10. Data Issue Management
  11. Data Maturity
  12. Data Maturity Model
  13. Data Owner
  14. Data Protection Officer (DPO)
  15. Data Roadmap
  16. Geospatial Tool
  17. Image Recognition (Computer Vision)
  18. Overfitting
  19. Pattern Recognition
  20. Robot (Robotics, Bot)
  21. Random Forest
  22. Structured Reporting Framework

Please remember that The Dictionary is a free resource and quoting contents (ideally with acknowledgement) and linking to its entries (via the buttons provided) are both encouraged.

If you would like to contribute a definition, which will of course be acknowledged, you can use the comments section here, or the dedicated form, we look forward to hearing from you [1].

If you have found The Data & Analytics Dictionary helpful, we would love to learn more about this. Please post something in the comments section or contact us and we may even look to feature you in a future article.

The Data & Analytics Dictionary will continue to be expanded in coming months.


Notes

 
[1]
 
Please note that any submissions will be subject to editorial review and are not guaranteed to be accepted.

peterjamesthomas.com

Another article from peterjamesthomas.com. The home of The Data and Analytics Dictionary, The Anatomy of a Data Function and A Brief History of Databases.


The Song Jane [Doe, CEO] Likes

Jane Doe, CEO & Diva

Note: This article was originally intended to be posted on 1st April 2020, but was delayed. I decided to share it now rather than waiting another year.

In my last post, we met Jane Doe, CEO. This article forms part of her further adventures [1]. The material may seem eerily familiar to anyone who – like me – has a pre-teen daughter.


The figures show red in the ledger of dread
Not a bright spot anywhere
A storm of profit warnings
And I’m tearing out my hair
Our shares are tumbling like the rain I hear outside
Can’t find out why, our accountants tried

We have no facts that we can trust
Much more of this and we’ll go bust
Oh what a bind, I have been blind
Well now I see…

CDO, CDO, they’ll know just what to do
CDO, CDO, they’ll help us to get through
I don’t care what I have to pay
Get us data now
I know that there’s got to be a better way


I’ve read how analytics
Can be really quite profound
And good quality of data
Can help us turn around

I heard machines can help us learn
And governance can have its turn
We need some stats to make things right
Insight!

CDO, CDO, can’t find me one anywhere
CDO, CDO, does no one really care?
Help us to create gold from clay
Get us data now…


Our CDO has helped us to work out a plan
With custom dashboards, every woman, every man
I slice our numbers now just like a piece of cake
We built a warehouse first, now for a data lake


CDO, CDO, we’re getting right back on track
CDO, CDO, our numbers are turning black
We all know that come what may
Got our data now
I knew that there had to be a better way…


  With apologies to the Dave Matthews Band (for the title); Robert Lopez, Kristen Anderson-Lopez and Christophe Beck (for the music); Chris Buck and Jennifer Lee (for the inspiration); Idina Menzel (I’m just so sorry Idina); and anyone else who knows me [2].  

Notes

 
[1]
 
Eat your heart out Arthur Conan-Doyle.
 
[2]
 
Plus The Disney Corporation for [hopefully] not suing.

peterjamesthomas.com

Another article from peterjamesthomas.com. The home of The Data and Analytics Dictionary, The Anatomy of a Data Function and A Brief History of Databases.

Data Strategy in a Working from Home Climate

The author, working from home together with his Executive AssistantThe author, working from home together with his Executive Assistant
© Jennifer Thomas Photographyview full photo.

When I occasionally re-read articles I penned back in 2009 or 2010, I’m often struck that – no matter how many things have undeniably changed over the intervening years in the data arena – there are some seemingly eternal verities. For example, it’s never just about the technology and indeed it’s seldom even predominantly about the technology [1]. True then, true now. These articles have a certain timeless quality to them. This is not that sort of article…

This is an article written at a certain time and in certain circumstances. I fervently hope that it rapidly becomes an anachronism.

Here and now, in late March 2020, many of us are adjusting to working from home for the first time on an extended basis [2]. In talking to friends and associates, this can be a difficult transition. Humans are inherently social animals and limiting our social interactions can be injurious to mental health. Fortunately, people also seem to be coming up with creative ways to stay in touch and the array of tools at our disposal to do this has never been greater.

In this piece, I wanted to talk about my first experience of extended home working. In my last article, Data Strategy Creation – A Roadmap, I hopefully gave some sense of the complexities involved in developing a commercially focussed Data Strategy. Well my task while home working for the first time was to do just that!

Back then, I ended up being successful without the benefit of more modern communications facilities, which is hopefully a helpful to learn for people today. Not only can you get by when working from home, you can take on some types of complicated work and do it well.

To provide some more colour, let’s go back to 2007 / 2008. Even in the midst of what was then obviously the Dark Ages, we did have email and even the Internet, but to be honest the “revolutionary” technology I used most often was well over a hundred years old at that point, let me introduce you to it…

Radical New Technology

First some context. I had successfully developed and then executed a Data Strategy for the European operations of a leading Global General Insurer. This work had played a pivotal role in returning the organisation to profitability following record losses. On the back of this, I was promoted to also be accountable for Data across the organisation’s businesses in Asia / Pacific, Canada and Latin America. The span of my new responsibilities is shown further down the page.

My first task was to develop an International Data Strategy. As per the framework that I began to develop as part of this assignment, I needed to speak to a lot of people, both business and technical. I needed to understand what was different about Insurance Markets as diverse as China and Brasil. I needed to understand a systems and data landscape spanning five continents. And – importantly – I needed to establish and then build on personal relationships with a lot of different people from different cultures in different locations. There was also the minor issue of time zones to be dealt with. Then I like a challenge.

Data Strategy - World Map

My transition to home working in this role was not driven by the type of deadly pathogen that we currently face, but by more quotidian considerations. The work I was initially doing primarily related to the activities tagged as 1.3 Business Interviews and 1.5 Technical Staff Discussions in my Data Strategy framework. Relative to this, I found that I was speaking to Singapore (where there was a team of data developers as well as several stakeholders) at 6am or even earlier; seguing to my continuing European responsibilities not long after; then had Latin and North America come on stream in the afternoon, going through until late; and sometimes picking things up with Australia or Asia Pacific locations at 11pm or midnight.

I was often writing up notes straight after meetings, or comparing them to previous ones looking for commonalities and teasing out themes. Because of this, there was not a lot of time for a commute to central London. Equally as I was on the ‘phone or email all of the time, there was little need for me to go into the office. So working from home became my “new normal”.

I could of course go into the office if I wanted to. It was also possible to go out and have a meal with my wife. Finally, I was not worried about getting sick or this happening to my family. So things were not so difficult as they are today. It did however take me some time to adjust to these different arrangements. One thing I learnt was that I couldn’t work solidly every day from 6am to midnight – an amazing revelation I realise. Given the extended nature of my day, I had to build breaks in.

Two Finger Boards

As I was working well in excess of my contractual hours, if a gap opened up in my day, I would do things like cycle to Regent’s Park and do laps of the outer circle. A major activity for me at the time was rock climbing and so I would take a break and work out on a training aid called a fingerboard, which we had two of (see above). Trying to hang from this by two fingers tended to clear the mind.

To return to the work, there were elements of this that blunted any feeling of isolation. Of course I ran my notes past the people interviewed, a second point of interaction. I also found a handful of people in each territory who were very positive about driving change through enhanced information. With these I held ongoing chats, discussing the views of their colleagues, contrasting these to those of other people around the organisation, sharing preliminary findings and nascent ideas for moving forward, getting their feedback on all of this. As well as helping me to have sounding boards for my ideas and getting alternative input, this was also great for building relationships; something that is harder over the ‘phone, but – as I found – far from impossible. However, it did require effort and, importantly, that effort needed to be sustained.

Something I thankfully figured out quite early was that email was not enough. Even with busy people on the other side of the world, perhaps particularly with busy people on the other side of the world, it was worth arranging time to talk. Despite the efficiency and convenience of email, I made a point of also speaking and of religiously rearranging any chats that fell through. Sometimes I wanted to just drop a colleague an email, but I tried to resist the temptation. In retrospect I think this approach helped a lot – on both ends of the ‘phone line.

Over time my work gradually shifted from gathering data to analysing and synthesising it, that is figuring out what the elements of the Data Strategy should be, for example current and future states. This is never an abrupt change, you start to analyse as soon as you have done a handful of interviews, but this work ramps up as more and more interviews are ticked off. Another thing that I found was, rather than sending people a whole slide deck and inviting comments, sharing one slide / exhibit at a time worked better. That way you assemble a deck out of agreed components and also have further opportunities for telephone interaction. If you are careful enough with structuring your individual slides, then the overall story can take care of itself, or at least require minimal “connective tissue” to be woven around it.

I won’t go into every aspect of this Data Strategy work, as the point of this article is instead to focus on the working from home element. However it is worth summarising the eventual number of interviews I held and documented:

Interviews by Geographic Area

I have no idea how many ‘phone calls that equated to, but it must have been an awful lot. Most of these were carried out over the initial three-month period, with a few stragglers picked up later in parallel with rounding out the Data Strategy. The whole exercise consumed a little under six months, with the back of the work broken in slightly more than four.

In closing, the Data Strategy I developed was adopted and the international data architecture that was later rolled out remains in place today; a testament to both the work done by the development teams, but also – I hope – to my vision. Since then, I have carried out a number of similar international exercises, though not always with the working from home component. I found the lessons I learned in that initial period invaluable. For example, I use many of the the approaches I developed in 2007 / 2008 in my work today as well.

So the closing message is that things are obviously far from normal right now. But – as challenging as working from home may seem – it is possible to be productive and also to lift your eyes above keeping the business running in order to contemplate more complicated transformation activities. I hope that this knowledge is of some help to those grappling, as I did years ago, with “the new normal”.


If – despite current circumstances – you need to develop a Data Strategy and would like some help, then please get in contact via the form provided. You can also speak to us on +44 (0) 20 8895 6826.


Notes

 
[1]
 
To see why, consider reading A bad workman blames his [Business Intelligence] tools.
 
[2]
 
I of course appreciate that many people do not have this option due to the type of work that they do. I also appreciate that many unfortunate people will have no work in current circumstances.

peterjamesthomas.com

Another article from peterjamesthomas.com. The home of The Data and Analytics Dictionary, The Anatomy of a Data Function and A Brief History of Databases.

Data Strategy Creation – A Roadmap

Data Strategy creation is one of the main pieces of work that I have been engaged in over the last decade [1]. In my last article, Measuring Maturity, I wrote about Data Maturity and how this relates to both Data Strategy and a Data Capability Review. Here I wanted to step back and look at the big picture.

The exhibit above is one that I use to chart my work in Data Strategy development [2]. An obvious thing to say upfront is that this is not a trivial exercise to embark on. There are many different interrelated activities, each one of which requires experience and expertise in both what makes businesses tick and the types of Data-related capabilities and organisation designs that can better support this. These need to be woven together to form the fabric of a Data Strategy and to deliver several other more detailed supporting documents, such as Data Roadmaps, or Cost / Benefit Analyses.

I tend to often tag Data Strategy with the adjective “commercial” and commercial awareness is for me what makes the difference between a Data Technology Strategy and a true Data Strategy. The latter has to be imbued with real commercial benefits being delivered.

Several of the activities in the diagram are looked at in greater detail in my trilogy on strategy development that starts with Forming an Information Strategy: Part I – General Strategy. I have also added some new areas to my approach since writing these articles back in 2014. As previously trailed, I will be penning a more comprehensive piece on Data Strategies in coming months.

I find Data Strategy creation a very rewarding process. Turning this into Data Capabilities that add business value is even more stimulating.

Having helped 10 organisations to develop their Data Strategies, the above activities are second nature to me. There is also a logical flow (mostly from left to right) and the various elements come together like the plot of a well-written book to yield the actual Data Strategy on the far right.

Data Strategy Guide

However I can appreciate that the complexity and reach of a Data Strategy exercise may seem rather daunting to someone looking at the area for the first time. In response to such a feeling, I’d suggest taking a leaf out of what used to be my main leisure activity, rock climbing [3]. I am a pretty experienced rock climber, but if I wanted to get into some unfamiliar aspect of the sport – say Alpinism – then I would make sure to hire a guide; someone whose experience and expertise I could rely upon and from whom I could also learn.

In my opinion, Data Strategy is an area in which such a guide is also indispensable.


Addendum

It was rightly pointed out by one of my associates, Andrew Willimott, that the above roadmap above does not explicitly reference Business Strategy. This is an very important point.

Here is an excerpt from some comments I made on this subject on Quora only the other day:

A sound commercially-focussed Data Strategy must be tailored to a specific organisation, the markets they operate in, the products or services they sell, the competitive landscape, their current Data Capabilities and – most importantly – their overarching business strategy.

I had this area implicitly covered by a combination of 1.2 Documentation Review and 1.3 Business Interviews, but I agree that the connection should be more explicit. The diagrams have now been revised accordingly with thanks to Andrew.


If you would like to better understand any aspect of the Data Strategy creation process, then please get in contact via the form provided. You can also speak to us on +44 (0) 20 8895 6826.


Notes

 
[1]
 
Often followed on by then helping to get the execution of the Data Strategy going.
 
[2]
 
I also use cut-down versions to play back progress to clients.
 
[3]
 
For example see A bad workman blames his [Business Intelligence] tools.

peterjamesthomas.com

Another article from peterjamesthomas.com. The home of The Data and Analytics Dictionary, The Anatomy of a Data Function and A Brief History of Databases.

Measuring Maturity

Maturity AssessmentThe author, engaged in measuring maturity – © Jennifer Thomas Photographyview full photo.

In the thirteen years that have passed since the beginning of 2007, I have helped ten organisations to develop commercially-focused Data Strategies [1]. I last wrote about the process of creating a Data Strategy back in 2014 and – with the many changes that the field has seen since then – am overdue publishing an update, so watch this space [2]. However, in this initial article, I wanted to to focus on one tool that I have used as part of my Data Strategy engagements; a Data Maturity Model.

A key element of developing any type of strategy is knowing where you are now and the pros and cons associated with this. I used to talk about carrying out a Situational Analysis of Data Capabilities, nowadays I am more likely to refer to a Data Capability Review. I make such reviews with respect to my own Data Capability Framework, which I introduced to the public in 2019 via A Simple Data Capability Framework.

Typically I break each of the areas appearing in boxes above into sub-areas, score the organisation against these, roll the results back up and present them back to the client with accompanying commentary; normally also including some sort of benchmark for comparison [3].

A Data Maturity Model is simply one way of presenting the outcome of a Data Capability Review; it has the nice feature of also pointing the way to the future. Such a model presents a series of states into which an organisation may fall with respect to its data. These are generally arranged in order, with the least beneficial state at the bottom and the most beneficial at the top. Data Maturity Models often adopt visual metaphors like ladders, or curves arching upwards, or – as I do myself – a flight of stairs. All of these metaphors – not so subtly – suggest ascending to a high state of being.

Here is the Data Maturity Model that I use:

The various levels of Data Maturity appear on the left, ranging from Disorder to Advanced and graded – in a way reminiscent of exams – between the lowest score of E and the highest of A. To the right of the diagram is the aforementioned “staircase”. Each “step” describes attributes of an organisation with the given level of Data Maturity. Here there is an explicit connection to the Data Capability Framework. The six numbered areas that appear in the Framework also appear in each “step” of the Model (and are listed in the Key); together with a brief description of the state of each Data Capability at the given level of Data Maturity. Obviously things improve as you climb up the “stairs”.

Of course organisations may be at a more advanced stage with respect to Data Controls than they are with Analytics. Equally one division or geographic territory might be at a different level with its Information than another. Nevertheless I generally find it useful to place an entire organisation somewhere on the flight of stairs, leaving a more detailed assessment to the actual Data Capability Review; such an approach tends to also resonate with clients.

So, supposing a given organisation is at level “D – Emergent”, an obvious question is where should it aspire to be instead? In my experience, not all organisations need to be at level “A – Advanced”. It may be that a solid “B – Basic” (or perhaps B+ splitting the difference) is a better target. Much as Einstein may have said that everything should be as simple as possible, but no simpler [4], Data Maturity should be as great as necessary, but no greater; over-engineering has been the downfall of many a Data Transformation Programme.

Of course, while I attempt to introduce some scientific rigour and consistency into both my Data Capability Reviews and the resulting Data Maturity Assessments, there is also an element of judgement to be applied; in many ways it is this judgement that I am actually paid to provide. When opining on an organisations state, I tend to lay the groundwork by first playing back what its employees say about this area (including the Executives that I am typically presenting my findings to). Most typically my own findings are fairly in line with what the average person says, but perhaps in general a bit less positive. Given my extensive work implementaing modern Data Architectures that deliver positive commercial outcomes, this is not a surprising state of affairs.

If a hypothetical organisation is at level “D – Emergent”, then the Model’s description of the next level up, “C – Transitional”, can provide strong pointers as to some of the activities that need to be undertaken in order to ratchet up Data Maturity one notch. The same goes for if more of a stepped-change to say, “B – Basic” is required. Initial ideas for improvement can be further buttressed by more granular Data Capability Review findings. The two areas should be mutually reinforcing.

One thing that I have found very useful is to revisit the area of Data Maturity after, for example, a year working on the area. If the organisation has scaled another step, or is at least embarked on the climb and making progress, this can be evidence of the success of the approach I have recommended and can also have a motivational effect.

As with many things, where you are with respect to Data Maturity is probably less important than your direction of travel.


If you would like to learn more about Data Maturity Models, or want to better understand how mature the data capabilities of your organisation are, then please get in touch, via the form provided. You can also speak to us on +44 (0) 20 8895 6826.


Notes

 
[1]
 
In case you were wondering, much of the rest of the time has been spent executing these Data Strategies, or at least getting the execution in motion. Having said that, I also did a lot of other stuff as per: Experience at different Organisations.

You can read about some of this work in our Case Studies section.

 
[2]
 
The first such article is Data Strategy Creation – A Roadmap.
 
[3]
 
I’ll be covering this area in greater detail in the forthcoming article I mentioned in the introductory paragraph.
 
[4]
 
There is actually very significant doubt that he actually ever uttered or wrote those words. However, in 1933, he did deliver a lecture which touched on similar themes. The closest that the great man came to saying the words attributed to him was:

It can scarcely be denied that the supreme goal of all theory is to make the irreducible basic elements as simple and as few as possible without having to surrender the adequate representation of a single datum of experience.

“On the Method of Theoretical Physics” the Herbert Spencer Lecture, Oxford, June 10, 1933.

peterjamesthomas.com

Another article from peterjamesthomas.com. The home of The Data and Analytics Dictionary, The Anatomy of a Data Function and A Brief History of Databases.


Put our Knowledge and Writing Skills to Work for you

peterjamesthomas.com White Papers can be very absorbing reads

As well as consultancy, research and interim work, peterjamesthomas.com Ltd. helps organisations in a number of other ways. The recently launched Data Strategy Review Service is just one example.

Another service we provide is writing White Papers for clients. Sometimes the labels of these are white [1] as well as the paper. Sometimes Peter James Thomas is featured as the author. White Papers can be based on themes arising from articles published here, they can feature findings from de novo research commissioned in the data arena, or they can be on a topic specifically requested by the client.

Seattle-based Data Consultancy, Neal Analytics, is an organisation we have worked with on a number of projects and whose experience and expertise dovetails well with our own. They recently commissioned a White Paper expanding on our 2018 article, Building Momentum – How to begin becoming a Data-driven Organisation. The resulting paper, The Path to Data-Driven, has just been published on Neal Analytics’ site (they have a lot of other interesting content, which I would recommend checking out):

Neal Analytics White Paper - The Path to Data-Driven
Clicking on the above image will take you to Neal Analytics’ site, where the White Paper may be downloaded for free and without registration

If you find the articles published on this site interesting and relevant to your work, then perhaps – like Neal Analytics – you would consider commissioning us to write a White Paper or some other document. If so, please just get in contact. We have a degree of flexibility on the commercial side and will most likely be able to come up with an approach that fits within your budget. Although we are based in the UK, commissions – like Neal Analytics’s one – from organisations based in other countries are welcome.


Notes

 
[1]
 
White-label Product – Wikipedia

 
peterjamesthomas.com

Another article from peterjamesthomas.com. The home of The Data and Analytics Dictionary, The Anatomy of a Data Function and A Brief History of Databases.


The peterjamesthomas.com Data Strategy Hub

The peterjamesthomas.com Data Strategy Hub
Today we launch a new on-line resource, The Data Strategy Hub. This presents some of the most popular Data Strategy articles on this site and will expand in coming weeks to also include links to articles and other resources pertaining to Data Strategy from around the Internet.

If you have an article you have written, or one that you read and found helpful, please post a link in a comment here or in the actual Data Strategy Hub and I will consider adding it to the list.


peterjamesthomas.com

Another article from peterjamesthomas.com. The home of The Data and Analytics Dictionary, The Anatomy of a Data Function and A Brief History of Databases.


Thank you to Ankit Rathi for including me in his list of Data Science / Artificial Intelligence practitioners that he admires

It’s always nice to learn that your work is appreciated and so thank you to Ankit Rathi for including me in his list of Data Science and Artificial Intelligence practitioners.

I am in good company as he also gives call outs to:


peterjamesthomas.com

Another article from peterjamesthomas.com. The home of The Data and Analytics Dictionary, The Anatomy of a Data Function and A Brief History of Databases.


The latest edition of The Data & Analytics Dictionary is now out

The Data and Analytics Dictionary

After a hiatus of a few months, the latest version of the peterjamesthomas.com Data and Analytics Dictionary is now available. It includes 30 new definitions, some of which have been contributed by people like Tenny Thomas Soman, George Firican, Scott Taylor and and Taru Väre. Thanks to all of these for their help.

  1. Analysis
  2. Application Programming Interface (API)
  3. Business Glossary (contributor: Tenny Thomas Soman)
  4. Chart (Graph)
  5. Data Architecture – Definition (2)
  6. Data Catalogue
  7. Data Community
  8. Data Domain (contributor: Taru Väre)
  9. Data Enrichment
  10. Data Federation
  11. Data Function
  12. Data Model
  13. Data Operating Model
  14. Data Scrubbing
  15. Data Service
  16. Data Sourcing
  17. Decision Model
  18. Embedded BI / Analytics
  19. Genetic Algorithm
  20. Geospatial Data
  21. Infographic
  22. Insight
  23. Management Information (MI)
  24. Master Data – additional definition (contributor: Scott Taylor)
  25. Optimisation
  26. Reference Data (contributor: George Firican)
  27. Report
  28. Robotic Process Automation
  29. Statistics
  30. Self-service (BI or Analytics)

Remember that The Dictionary is a free resource and quoting contents (ideally with acknowledgement) and linking to its entries (via the buttons provided) are both encouraged.

If you would like to contribute a definition, which will of course be acknowledged, you can use the comments section here, or the dedicated form, we look forward to hearing from you [1].

If you have found The Data & Analytics Dictionary helpful, we would love to learn more about this. Please post something in the comments section or contact us and we may even look to feature you in a future article.

The Data & Analytics Dictionary will continue to be expanded in coming months.


Notes

 
[1]
 
Please note that any submissions will be subject to editorial review and are not guaranteed to be accepted.

peterjamesthomas.com

Another article from peterjamesthomas.com. The home of The Data and Analytics Dictionary, The Anatomy of a Data Function and A Brief History of Databases.


Why do data migration projects have such a high failure rate?

Data Migration (under GNU Manifesto)

Similar to its predecessor, Why are so many businesses still doing a poor job of managing data in 2019? this brief article has its genesis in the question that appears in its title, something that I was asked to opine on recently. Here is an expanded version of what I wrote in reply:

Well the first part of the answer is based on consideing activities which have at least moderate difficulty and complexity associated with them. The majority of such activities that humans attempt will end in failure. Indeed I think that the oft-reported failure rate, which is in the range 60 – 70%, is probably a fundamental Physical constant; just like the speed of light in a vacuum [1], the rest mass of a proton [2], or the fine structure constant [3].

\alpha=\dfrac{e^2}{4\pi\varepsilon_0d}\bigg/\dfrac{hc}{\lambda}=\dfrac{e^2}{4\pi\varepsilon_0d}\cdot\dfrac{2\pi d}{hc}=\dfrac{e^2}{4\pi\varepsilon_0d}\cdot\dfrac{d}{\hbar c}=\dfrac{e^2}{4\pi\varepsilon_0\hbar c}

For more on this, see the preambles to both Ever tried? Ever failed? and Ideas for avoiding Big Data failures and for dealing with them if they happen.

Beyond that, what I have seen a lot is Data Migration being the poor relation of programme work-streams. Maybe the overall programme is to implement a new Transaction Platform, integrated with a new Digital front-end; this will replace 5+ legacy systems. When the programme starts the charter says that five years of history will be migrated from the 5+ systems that are being decommissioned.

The revised estimate is how much?!?!?

Then the costs of the programme escallate [4] and something has to give to stay on budget. At the same time, when people who actually understand data make a proper assessment of the amount of work required to consolidate and conform the 5+ disparate data sets, it is found that the initial estimate for this work [5] was woefully inadequate. The combination leads to a change in migration scope, just two years historical data will now be migrated.

Rinse and repeat…

The latest strategy is to not migrate any data, but instead get the existing data team to build a Repository that will allow users to query historical data from the 5+ systems to be decommissioned. This task will fall under BAU [6] activities (thus getting programme expenditure back on track).

The slight flaw here is that building such a Repository is essentially a big chunk of the effort required for Data Migration and – of course – the BAU budget will not be enough for this quantum work. Oh well, someone else’s problem, the programme budget suddenly looks much rosier, only 20% over budget now…

Note: I may have exaggerated a bit to make a point, but in all honesty, not really by that much.


Notes

 
[1]
 
c\approx299,792,458\text{ }ms^{-1}
 
[2]
 
m_p\approx1.6726 \times 10^{-27}\text{ }kg
 
[3]
 
\alpha\approx0.0072973525693 
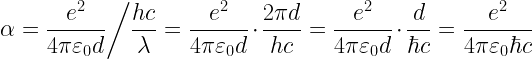
– which doesn’t have a unit (it’s dimensionless)
 
[4]
 
Probably because they were low-balled at first to get it green-lit; both internal and external teams can be guilty of this.
 
[5]
 
Which was do doubt created by a generalist of some sort; or at the very least an incurable optimist.
 
[6]
 
BAU of course stands for Basically All Unfunded.

peterjamesthomas.com

Another article from peterjamesthomas.com. The home of The Data and Analytics Dictionary, The Anatomy of a Data Function and A Brief History of Databases.