Some thoughts on the IRM(UK) DW/BI conference

As previously advertised, I presented at the recent IRM(UK) DW/BI seminar in London. As a speaker I was entitled to attend the full three days, but as is typically the case, other work commitments meant that I only went along on the day of my session, 4th November. A mixture of running into business acquaintances, making sure that audio/visual facilities work and last minute run-throughs of my slides all conspired to ensure that I was able to listen to fewer talks that I would have liked. In comparing notes with other speakers, it is generally the same for them. Maybe I should consider attending a seminar as a delegate sometime!

Nevertheless, I did get along to some presentations and also managed to finally meet Dylan Jones of dataqualitypro.com (@DataQualityPro) in person after running into each other virtually for years. Unfortunatlely, I also managed to fail to connect with a number of tweeps of my acquaintance including: Loretta Mahon Smith (@silverdata) – who even attended my talk without us bumping into each other – and Scott Davis (@scottatlyzasoft); I guess that is just how it goes with seminars sometimes.
 
 
Story-telling and Information Quality

Ma mère l'oye by Gustave Doré (for the avoidance of doubt, I'm not saying that Lori is Mother Goose)

At face value these may seem odd bed-fellows. However, Lori Silverman of Partners for Progress managed to intertwine the two effectively. This was despite being handicapped by an attack of laryngitis that meant that her, already somewhat nasal tones, from time to time morphed into a shriek. Sitting as I was directly beside a loudspeaker, I felt some initial discomfort and even considered departing for a less auricularly challenged part of the conference centre. However I was glad that I decided to tough it out because Lori turned out to be a very entertaining, engaging and insightful speaker. I won’t steal her thunder by revealing her main thesis and instead suggest that you try to catch her speaking at some future point, she is well worth listening to in my opinion.
 
 
Open Source BI makes headway in the Irish Government sector

Jaspersoft and System Dynamics

I next attended a presentation by leading open source BI company Jaspersoft. This was kicked-off by their CEO Brian Gentile who then introduced a case study about an Irish Government department rolling-out the company’s products. The implementer, was System Dynamics, Ireland’s largest indigenous IT business solutions company*.

System Dynamics CEO Tony McGuire and BI Team Lead Emmet Burke both spoke about this recent project, which covered 500+ users. Open source has traditionally had something of a challenge establishing a foothold in the public sector. The assertion made in this session was that the current fiscal challenges faced by the Irish Republic meant that it was becoming an option they were giving greater credence to. I guess, as with many areas of open source applications, it is probably a case of waiting to see whether a trend establishes itself.

John Taylor of Information Builders was speaking in the room that would next host my session and so I was able to catch the last 15 minutes of his presentation on Information Management, which seemed to have been well-attended and well-received.
 
 
Measuring the benefits of BI

My presentation occupied the graveyard slot of 4:30pm and I led by saying that I fully realised that all that stood between delegates and the drinks reception was my talk. Given the lateness of the hour, I had been a little concerned about attendance, but I guess that there were at least 50 or so people present. All of them stuck it out to the bitter end, which was gratifying.

There is always the moment of frisson in public speaking when, at the end of the talk, you ask whether are any questions with an image of tumbleweed spinning across the prairie in your mind (something that happened to me on one previous occasion a long time ago). Thankfully the audience asked a number of interesting and insightful questions, which I answered to the best of my ability. Indeed I was locked in discussions with a couple of delegates long after the meeting had officially broken up.

Measuring the success of BI - Agenda

In my introduction, I began by issuing my customary caveat about the danger of too blindly following any recipe for success. I then provided some background about my first major achievement in data warehousing and went on to present the general framework for success in BI/DW programmes that I developed as a result of this. In concluding the first part of the speech, I attempted to delineate the main benefits of BI and also touched on some of its limitations.

Having laid these hopefully substantial foundations, the meat of the presentation expanded on ideas I briefly touched on in my earlier article Measuring the Benefits of Business Intelligence. This included highlighting some of the reasons why measuring the impact of BI on, say, profitability can be a challenge, but stressing that this was still often an objective that it was possible to achieve. I also spent some time examining in detail different techniques for quantifying the different tangible and intangible impacts of BI (most of which are covered in the above referenced article).

A sporting analogy by the back-door - England's victory in the 2003 Rugby World Cup, which was clearly inspired by the successful launch of the first phase of the EMIR BI/DW system at Chubb Insurance earlier in the year

My closing thought was that, in situations where it is difficult to precisely assess the monetary impact of BI, the wholehearted endorsement of your business customers can be a the best indirect measurement of the success (or otherwise) of your work. I would recommend that fellow BI professionals pay close attention to this important indicator at all stages of their projects.


You can view some of the tweets about IRM(UK) DW/BI here, or here.
 
Disclosure: At the time of writing, System Dynamics is a business partner, but not in the field of business intelligence.

 

Another social media-inspired meeting

Lights, camera, action!

Back in June 2009, I wrote an article entitled A first for me. In this I described meeting up with Seth Grimes (@SethGrimes), an acknowledged expert in analytics and someone I had initially “met” via Twitter.com.

I have vastly expanded my network of international contacts through social media interactions such as these. Indeed I am slated to meet up with a few other people during November; a month in which I have a couple of slots speaking at BI/DW conferences (IRM later this week and Obis Omni towards the end of the month).

Another person that I became a virtual acquaintance of via social media is Bruna Aziza (@brunoaziza), Worldwide Strategy Lead for Business Intelligence at Microsoft. I originally “met” Bruno via LinkedIn.com and then also connected on Twitter.com. Later Bruno asked me for my thoughts on his article, Use Business Intelligence To Compete More Effectively, and I turned these into a blog post called BI and competition.

bizintelligence.tv - by Bruno Aziza of Microsoft

We have kept in touch since and last week Bruno asked me to be interviewed on the bizintelligence.tv channel that he is setting up. It was good to meet in person and I thought that we had some interesting discussions. Though I have done video and audio interviews before with organisations like IBM Cognos, Informatica, Computing Magazine and SmartDataCollective (see the foot of this article for links), these were mostly a while back and so it was interesting to be in front of a camera again.

The bizintelligence.tv format seems to be an interesting one, with key points in BI discussed in a focussed and punchy manner (not an approach that I am generally associated with) and a target audience of busy senior IT managers. As I have remarked elsewhere, it is also notable that the more foresighted of corporations are now taking social media seriously and getting quite good at engaging without any trace of hard selling; something that perhaps compromised the earlier efforts of some organisations in this area (for the avoidance of doubt, this is a general comment and not one levelled at Microsoft).

Bruno and I touched on a number of areas including, driving improvements in data quality, measuring the value of BI programmes, using historical data to justify BI investments (something that I am overdue writing about – UPDATE: now remedied here) and the cultural change aspect of BI. I am looking forward to seeing the results. Watch this space and in the meantime, take a look at some of the earlier interviews that Bruno has conducted.


Other video and audio interviews that I have recorded:


I will be speaking at the Obis Omni 2010 Forum

Obis Omni is a Business Intelligence community and resource with whom I have worked for several years. Since September 2008, I have set aside time to speak at their well-organised annual forums.

2010 is no exception and I will be attending this year’s event in London on 25 November at The Park Plaza Hotel.


Previous articles relating to Obis Omni events (and those of their sister organisation, The Cloud Circle) include:


I will be presenting at the IRM European Data Warehouse and Business Intelligence Conference

This IRM UK event will be taking place in central London from the 3rd to 5th November 2010. It is co-located with two other related IRM conferences: Data Management and Information Quality. Full details may be obtained from the IRM conference web-site here.
 

tweet this Tweet this article on twitter.com
Bookmark this article with:
| Facebook | del.icio.us | digg | Reddit | Stumble


Informatica interview

While spring cleaning at home at the weekend, I came across a DVD of an interview I did for Informatica back in March 2005. This is still accessible on the Informatica web-site and appears in my video library, but I thought that I had lost my copy of the original.

Having made this discovery, I added it to my selection of videos on YouTube.com.


In the interview I stress the need for consistency in management information; the dynamics of the Insurance industry and the business value added by Business Intelligence in a pan-European insurance organisation.


Disclosure – Part I: In the work I refer to above, I leveraged Infomatica’s toolset (PowerCentre) alongside software from Oracle (RDBMS and PL/SQL), IBM Cognos (PowerPlay and ReportStudio) and Microsoft (.NET). I have used tools from other vendors in other projects. While there is clearly a promotional sub-text to the video, it is not a product endorsement and I believe that my comments are generally applicable to any business intelligence / data warehousing project.
 
Disclosure – Part II: I have already had it pointed out to me – by @ocdqblog and others – that the braces (suspenders if you are from the US; suspenders having quite a different connotation in the UK) were perhaps something of a fashion faux pas. My American partner has long since despaired of my British approach to “co-ordination” of patterns. You may be glad to know that I no longer own the offending item.
 

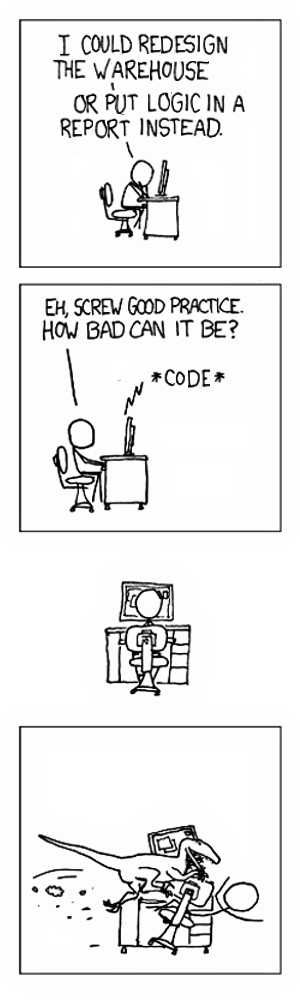
Business logic

The dot product of the original sketch and my plagiarism of it is 0

With enormous apologies to Randall Munroe of xkcd.com fame; from whose much funnier, and obviously more original, sketch entitled “GOTO” the above was shamelessly adapted.


Comic strip adapted with the kind permission of the copyright holder.
 

Aphorism of the week

“Just because Jeffrey Archer exists, it doesn’t follow that Joseph Conrad can’t have existed”

Jeffrey Archer Joseph Conrad

Introduction

The context of the above bon mot was – as is often the case – a discussion on LinkedIn.com. I have been rather absent from the LinkedIn.com discussion groups for the same reasons that I have not been blogging and tweeting. In this case, my attention was drawn to the debate by a colleague.

linkedin CIOs.com: Chief Information Officer Network

The particular thread was posted by Andy McKnight and is entitled What’s missing from Business Intelligence? and at the time of writing has attracted nearly 60 responses (you have to be a member of the group to view the discussion). It referred to an article published by EMC2 which has the strap-line How CIOs can Reap the Benefits of BI Technology (note: this is a PDF document). Here is a pertinent quote:

The bad news is that only twenty-seven percent of respondents [to a survey of CIOs carried out by IDG Research] who use a BI solution report being extremely successful or very successful with it. Forty-five percent report being only somewhat successful, while seventeen percent say that they are not very, or not at all successful.

I’m not sure what happened to the other 11% of respondents, maybe they just hung up the ‘phone.
 
 
Blaming the users

"Users are the root of all evil" - anonymous [failed] BI Project Manager

Having stated that “BI has, too often, not lived up to expectations”, the paper goes on to list some reasons why. First on the list is the following:

  • lack of adoption by users

You don’t have to be Einstein to realise that this is the result of a BI project failing, not the cause of it. The equivalent in athletics terms would be to say that you came last in the race because everyone else was faster than you. While obviously true this observation doesn’t help a lot with how to do better next time.

Of course hidden in the comment is the plaintive whine heard emanating from many an unsuccessful project (or indeed product launch), “the problem is the users”. This is arrant nonsense, returning to the start of article if you write a book that is panned by the critics and not bought by the public, then there is at least some chance that the fault lies with you and not them. It is the job of the IT professional to know their users, understand their needs and provide systems that cause delight, not disillusion.

A more interesting observation later on is:

Many BI initiatives falter because the analytics capabilities that are at the core of the system aren’t even used. Many users simply pull data from the warehouse and dump it in a spreadsheet. […] A true BI implementation includes both reporting and analytics. CIOs indicate a much higher success rate with BI when users embrace both.

I think that there is some truth in this. Some of the BI failures I have seen have gone to the bother of building a warehouse only to front it with flat reports that are only marginally better than what they replaced.

In my career I have taken the opposite approach. While many people warn against analysis paralysis, I have deployed OLAP tools to all users, with fixed format reports de-emphasised, or used mostly for external purposes. This does mean that more effort needs to be put into training, but this is necessary anyway if you want your BI system to be an agent of change (and why else would you be building one if this is not the case?). I cover my general approach to driving user adoption in a series of three articles as follows:

This approach was very successful and we achieved user adoption of 92% – i.e. of those people who attended training, 92% remained active users (defined as using the BI system on average for at least two extended periods each week). We actually felt that the OLAP tools we were implementing were pretty intuitive and easy-to-use and so focussed mostly on how to use them in specific business scenarios. Overall we felt that training was 25% technical and 75% business-related.
 
 
Aiming for simplicity

Simplicity - with apologies to whoever thought of the image first

Related to the above point, the EMC2 article also mentions the following reason for failure:

  • limited functionality/hard to use

This seems a little oxymoronic as normally it is depth of functionality that confuses people. I think I would disagree with both parts of this point. Out of the box, most BI tools have rich functionality and a reasonably intuitive to use. In one response to the LinkedIn.com thread I said the following:

I have been successful in getting users […] weaned […] off ad hoc reports, it wasn’t an easy process and required persistence and selling, but this paid off. […] It is illuminating seeing business managers (some of whom still dictate memos for their secretaries to type) “slicing and dicing”, drilling down/through and generally interacting away merrily and stating that if all IT was this easy to use and informative, they might have taken to it earlier.

My view here is that you can make the tool as complicated or a simple as you choose. Going back to my first warehouse project, in our somewhat naive early attempts at prototype cubes, we had all available dimensions and all available measures included. I think our idea is that the users could help us sift out the ones that were most important. Instead this approach caused the negative reactions that the article refers to.

We subsequently adopted a rule of having as few dimensions and measures as possible in a cube, without compromising the business need that the cube was trying to address. The second part of this rule was that every cube had to be focussed on answering business questions in at least one area and at most two.

Rather than having a small number of monolithic cubes, we went with the option of a slightly larger number of significantly clearer and simpler ones. I think that this was a factor in our success in driving business adoption.
 
 
Should the fact that some BI projects fail dissuade you from BI?

I won’t attempt to dissect the rest of the article, the areas that I comment on above are representative. There are some good points and some less good ones – just like any article, including of course my own. Take a look yourself and see whether the findings and recommendations chime with your own experience of success and failure. What I did want to do was to return to the context of the aphorism that starts this post.

The thesis of the original LinkedIn.com post was that because a significant number of organisations had failed to get enormous benefit from BI, BI itself was therefore somehow flawed. I think this is wrong-headed reasoning. If 1,000 people write a book, how many are likely to become acknowledged as great authors? How many are likely to have the lesser accolade of commercial success? The answer in both cases is “not many”. This is because writing well is a very difficult thing to do (I prove this myself with every blog post!). Not everyone who tries it will be successful. BI is also difficult to do well and a major cause of problems is underestimating this difficulty.

Maybe this is too recherché and example, and maybe if the chances of success with BI are as slim as winning the Purlitzer Prize then it is not worth the effort. So I’ll instead I’ll resort to my favourite area of the sporting analogy. Let’s take the same 1,000 people and say that they all take up a new sport – it is mostly immaterial what the sport is, let’s say tennis. How many of them will go on to become proficient in it? By this I don’t mean that they are the next Roger Federer, just that they become competent enough to serve adequately, master the dark arts of the backhand and sustain a few rallies. My feeling is that the stats would look something like those in the EMC2 report.
 
 
Is the prize worth it?

Alfred's gong

Given this, does it mean that some companies are just not cut out for BI and should ignore the area? Well the answer is “it depends”. Going back to tennis, if some one wants to be good, and has the determination to succeed, that is a necessary (though sadly not sufficient) condition. What may drive such a person on is the objective of achieving a goal, or maybe the pleasure of being able to perform at a certain level.

Focussing on business outcomes, I believe that BI can deliver substantial benefits. In fact I have argued elsewhere that BI can have the greatest payback of any IT project. Of course this presupposes that the BI project is done well. If the prize is potentially that great then maybe – like the aspiring tennis player who wants to become better – trying again makes sense. In recent recruitment I have heard frequent mention of organisations that were building their second warehouse as they didn’t get the first one quite right.

However the comparison with tennis breaks down in that business is a team game. If an organisation as a whole has struggled with BI, then this is not a question of simply accepting your genetic limitations. Companies can “evolve” capabilities by hiring people who have been successful in a field. They can also get benefit from targeted consultancy from practitioners who have a track record of success; this can help them to build an internal capability. This is an approach that I took advantage of myself in the initial six months of my first BI project [note: although I often seem to get mistaken for a BI consultant, I am not touting for business here!].

This means that if a company’s BI architecture is currently the equivalent of a Jeffrey Archer novel, it is still possible to transform it into Heart of Darkness. It will not be easy and will take time and effort, but there are people out there who have been successful and can act as guides.

Not the ideal end of a BI journey

In closing I should also mention that, if you take appropriate precautions, it is far from inevitable that the end of a BI journey will be finding your own version of Kurtz!
 

A recording of me being interviewed by Brian Roger of SmartDataCollective.com

SmartDataCollective.com

I have been a featured blogger on SmartDataCollective.com almost as long as I have been a blogger. SDC.com is Social Media Today’s community site, focussed on all aspects of Business Intelligence, Data Warehousing and Analytics, with a pinch of social media thrown in to the mix.

Brian Roger, the SDC.com editor, was recently kind enough to interview me about my career in BI, the challenges I have faced and what has helped to overcome these. This interview is now available to listen to as part of their Podcast series – click on the image below to visit their site.

sdc-podcast

SmartDataCollective.com Intervew

I would be interested in feedback about any aspect of this piece, which I am grateful to Brian for arranging.


Social Media Today LLC helps global organizations create purpose-built B2B social communities designed to achieve specific, measurable corporate goals by engaging exactly the customers and prospects they most want to reach. Social Media Today helps large companies leverage the enormous power of social media to build deeper relationships with potential customers and other constituencies that influence the development of new business. They have found that their primary metrics of success are levels of engagement and business leads. One thousand people who come regularly and might buy an SAP, Oracle or Teradata system some day is better than a million people who definitely won’t.

Social Media Today LLC, is a battle-tested, nimble team of former journalists, online managers, and advertising professionals who have come together to make a new kind of media company. With their backgrounds, and passions for, business-to-business and public policy conversations, they have decided to focus their efforts in this area. To facilitate the types of convresations that they would like to see Social Media Today is assembling the world’s best bloggers and providing them with an independent “playground” to include their posts, to comment and rate posts, and to connect with each other. On their flagship site, SocialMediaToday.com, they have brought together many of the most intriguing and original bloggers on media and marketing, covering all aspects of what makes up the connective tissue of social media from a global perspective.
 

Using multiple business intelligence tools in an implementation – Part II

Rather unsurprisingly, this article follows on from: Using multiple business intelligence tools in an implementation – Part I.

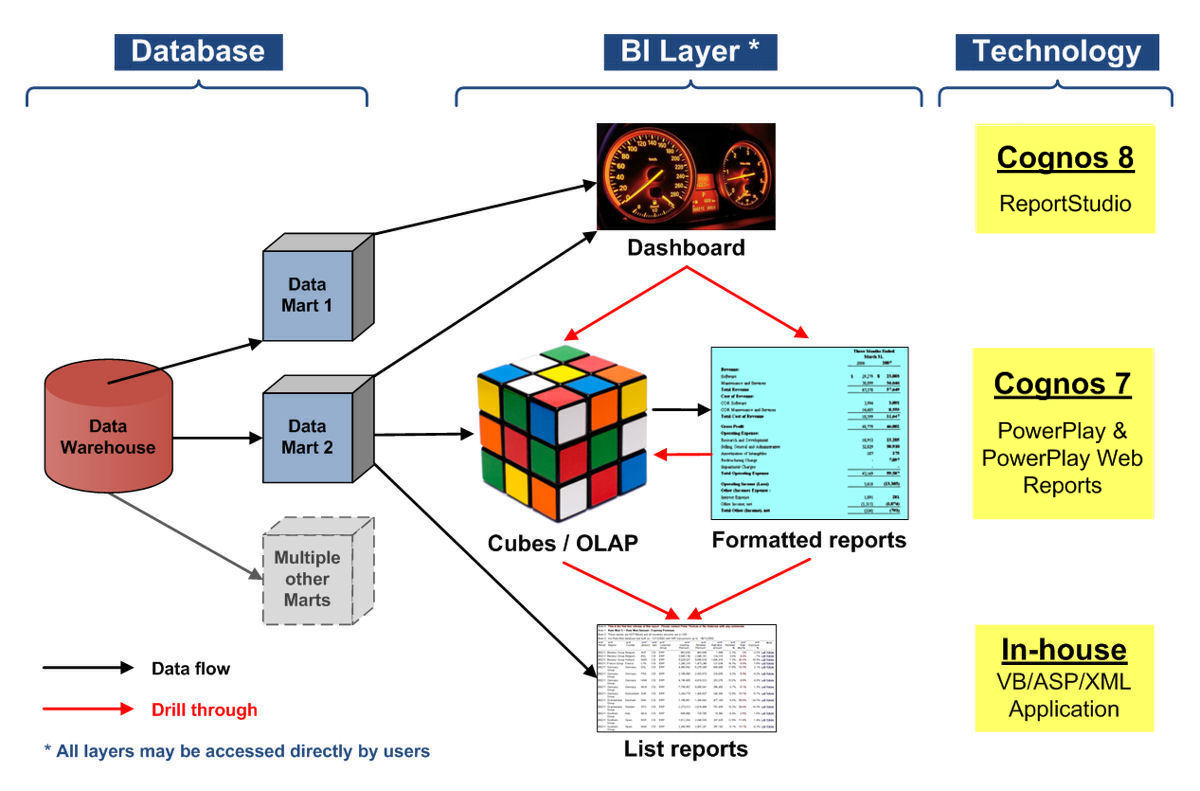
On further reflection about this earlier article, I realised that I missed out one important point. This was perhaps implicit in the diagram that I posted (and which I repeat below), but I think that it makes sense for me to make things explicit.

An example of a multi-tier BI architecture with different tools

The point is that in this architecture with different BI tools in different layers, it remains paramount to have consistency in terminology and behaviour for dimensions and measures. So “Country” and “Profit” must mean the same things in your dashboard as it does in your OLAP cubes. The way that I have achieved this before is to have virtually all of the logic defined in the warehouse itself. Of course some things may need to be calculated “on-the-fly” within the BI tool, in this case care needs to be paid to ensuring consistency.

It has been pointed out that the approach of using the warehouse to drive consistency may circumscribe your ability to fully exploit the functionality of some BI tools. While this is sometimes true, I think it is not just a price worth paying, but a price that it is mandatory to pay. Inconsistency of any kind is the enemy of all BI implementations. If your systems do not have credibility with your users, then all is already lost and no amount of flashy functionality will save you.
 

Using multiple business intelligence tools in an implementation – Part I

linkedin The Data Warehousing Institute The Data Warehousing Institute (TDWI™) 2.0

Introduction

This post follows on from a question that was asked on the LinkedIn.com Data Warehousing Institute (TDWI™) 2.0 group. Unfortunately the original thread is no longer available for whatever reason, but the gist of the question was whether anyone had experience with using a number of BI tools to cover different functions within an implementation. So the scenario might be: Tool A for dashboards, Tool B for OLAP, Tool C for Analytics, Tool D for formatted reports and even Tool E for visualisation.

In my initial response I admitted that I had not faced precisely this situation, but that I had worked with the set-up shown in the following diagram, which I felt was not that dissimilar:

An example of a multi-tier BI architecture with different tools

Here there is no analytics tool (in the statistical modelling sense – Excel played that role) and no true visualisation (unless you count graphs in PowerPlay that is), but each of dashboards, OLAP cubes, formatted reports and simple list reports are present. The reason that this arrangement might not at first sight appear pertinent to the question asked on LinkedIn.com is that two of the layers (and three of the report technologies) are from one vendor; Cognos at the time, IBM-Cognos now. The reason that I felt that there was some relevance was that the Cognos products were from different major releases. The dashboard tool being from their Version 8 architecture and the OLAP cubes and formatted reports from their Version 7 architecture.
 
 
A little history

London Bridge circa 1600

Maybe a note of explanation is necessary as clearly we did not plan to have this slight mismatch of technologies. We initially built out our BI infrastructure without a dashboard layer. Partly this was because dashboards weren’t as much of a hot topic for CEOs when we started. However, I also think it also makes sense to overlay dashboards on an established information architecture (something I cover in my earlier article, “All that glisters is not gold” – some thoughts on dashboards, which is also pertinent to these discussions).

When we started to think about adding icing to our BI cake, ReportStudio in Cognos 8 had just come out and we thought that it made sense to look at this; both to deliver dashboards and to assess its potential future role in our BI implementation. At that point, the initial Cognos 8 version of Analysis Studio wasn’t an attractive upgrade path for existing PowerPlay users and so we wanted to stay on PowerPlay 7.3 for a while longer.

The other thing that I should mention is that we had integrated an in-house developed web-based reporting tool with PowerPlay as the drill down tool. The reasons for this were a) we had already trained 750 users in this tool and it seemed sensible to leverage it and b) employing it meant that we didn’t have to buy an additional Cognos 7 product, such as Impromptu, to support this need. This hopefully explains the mild heterogeneity of our set up. I should probably also say that users could directly access any one of the BI tools to get at information and that they could navigate between them as shown by the arrows in the diagram.

I am sure that things have improved immensely in the Cognos toolset since back then, but at the time there was no truly seamless integration between ReportStudio and PowerPlay as they were on different architectures. This meant that we had to code the passing of parameters between the ReportStudio dashboard and PowerPlay cubes ourselves. Although there were some similarities between the two products, there were also some differences at the time and these, plus the custom integration we had to develop, meant that you could also view the two Cognos products as essentially separate tools. Add in here the additional custom integration of our in-house reporting application with PowerPlay and maybe you can begin to see why I felt that there were some similarities between our implementation and one using different vendors for each tool.

I am going to speak a bit about the benefits and disadvantages of having a single vendor approach later, but for now an obvious question is “did our set-up work?” The answer to this was a resounding yes. Though the IT work behind the scenes was maybe not the most elegant (though everything was eminently supportable), from the users’ perspective things were effectively seamless. To slightly pre-empt a later point, I think that the user experience is what really matters, more than what happens on the IT side of the house. Nevertheless let’s move on from some specifics to some general comments.
 
 
The advantages of a single vendor approach to BI

One-stop shopping
One-stop shopping

I think that it makes sense if I lay my cards on the table up-front. I am a paid up member of the BI standardisation club. I think that you only release the true potential of BI when you take a broad based approach and bring as many areas as you can into your warehouse (see my earlier article, Holistic vs Incremental approaches to BI, for my reasons for believing this).

Within the warehouse itself there should be a standardised approach to dimensions (business entities and the hierarchies they are built into should be the same everywhere – I’m sure this will please all my MDM friends out there) and to measures (what is the point if profitability is defined different ways in different reports?). It is almost clichéd nowadays to speak about “the single version of the truth”, but I have always been a proponent of this approach.

I also think that you should have the minimum number of BI tools. Here however the minimum is not necessarily always one. To misquote one of Württemberg’s most famous sons:

Everything should be made as simple as possible, but no simpler.

What he actually said was:

It can scarcely be denied that the supreme goal of all theory is to make the irreducible basic elements as simple and as few as possible without having to surrender the adequate representation of a single datum of experience.

but maybe the common rendition is itself paying tribute to the principle that he propounded. Let me pause to cover what are the main reasons quoted for adopting a single vendor approach in BI:

  1. Consistent look-and-feel: The tools will have a common look-and-feel, making it easier for people to use them and simplifying training.
  2. Better interoperability: Interoperability between the tools is out-of-the-box, saving on time and effort in developing and maintaining integration.
  3. Clarity in problem resolution: If something goes wrong with your implementation, you don’t get different vendors blaming each other for the problem.
  4. Simpler upgrades: You future proof your architecture, when one element has a new release, it is the vendor’s job to ensure it works with everything else, not yours.
  5. Less people needed: You don’t need to hire an expert for each different vendor tool, thereby reducing the size and cost of your BI team.
  6. Cheaper licensing: It should be cheaper to buy a bundled solution from one vendor and ongoing maintenance fees should also be less.

This all seems to make perfect sense and each of the above points can be seen to be reducing the complexity and cost of your BI solution. Surely it is a no-brainer to adopt this approach? Well maybe. Let me offer some alternative perspectives on each item – none of these wholly negates the point, but I think it is nevertheless worth considering a different perspective before deciding what is best for your organisation.

  1. Consistent look-and-feel: It is not always 100% true that different tools from the same vendor have the same look-and-feel. This might be down to quality control at the vendor, it might be because the vendor has recently acquired part of their product set and not fully integrated it as yet, or – even more basically – it may be because different tools are intended to do different things. To pick one example from outside of BI that has frustrated me endlessly over the years: PowerPoint and Word seem to have very little in common, even in Office 2007. Hopefully different tools from the same vendor will be able to share the same metadata, but this is not always the case. Some research is probably required here before assuming this point is true. Also, picking up on the Bauhaus ethos of form dictating function, you probably don’t want to have your dashboard looking exactly like your OLAP cubes – it wouldn’t be a dashboard then would it? Additional user training will generally be required for each tier in your BI architecture and a single-vendor approach will at best reduce this somewhat.
  2. Better interoperability: I mention an problem with interoperability of the Cognos toolset above. This is is hopefully now a historical oddity, but I would be amazed if similar issues do not arise at least from time to time with most BI vendors. Cognos itself has now been acquired by IBM and I am sure everyone in the new organisation is doing a fine job of consolidating the product lines, but it would be incredible if there were not some mismatches that occur in the process. Even without acquisitions it is likely that elements of a vendor’s product set get slightly out of alignment from time to time.
  3. Clarity in problem resolution: This is hopefully a valid point, however it probably won’t stop your BI tool vendor from suggesting that it is your web-server software, or network topology, or database version that is causing the issue. Call me cynical if you wish, I prefer to think of myself as a seasoned IT professional!
  4. Simpler upgrades: Again this is also most likely to be a plus point, but problems can occur when only parts of a product set have upgrades. Also you may need to upgrade Tool A to the latest version to address a bug or to deliver desired functionality, but have equally valid reasons for keeping Tool B at the previous release. This can cause problems in a single supplier scenario precisely because the elements are likely to be more tightly coupled with each other, something that you may have a chance of being insulated against if you use tools from different vendors.
  5. Less people needed: While there might be half a point here, I think that this is mostly fallacious. The skills required to build an easy-to-use and impactful dashboard are not the same as building OLAP cubes. It may be that you have flexible and creative people who can do both (I have been thus blessed myself in the past in projects I ran), but this type of person would most likely be equally adept whatever tool they were using. Again there may be some efficiencies in sharing metadata, but it is important not to over-state these. You may well still need a dashboard person and an OLAP person, if you don’t then the person who can do both with probably not care about which vendor provides the tools.
  6. Cheaper licensing: Let’s think about this. How many vendors give you Tool B free when you purchase Tool A? Not many is the answer in my experience, they are commercial entities after all. It may be more economical to purchase bundles of products from a vendor, but also having more than one in the game may be an even better way of ensuring that cost are kept down. This is another area that requires further close examination before deciding what to do.

 
A more important consideration

Overall it is still likely that a single-vendor solution is cheaper than a multi-vendor one, but I hope that I have raised enough points to make you think that this is not guaranteed. Also the cost differential may not be as substantial as might be thought initially. You should certainly explore both approaches and figure out what works best for you. However there is another overriding point to consider here, the one I alluded to earlier; your users. The most important thing is that your users have the best experience and that whatever tools you employ are the ones that will deliver this. If you can do this while sticking to a single vendor then great. However if your users will be better served by different tools in different tiers, then this should be your approach, regardless of whether it makes things a bit more complicated for your team.

Of course there may be some additional costs associated with such an approach, but I doubt that this issue is insuperable. One comparison that it may help to keep in mind is that the per user cost of many BI tools is similar to desktop productivity tools such as Office. The main expense of BI programmes is not the tools that you use to deliver information, but all the work that goes on behind the scenes to ensure that it is the right information, at the right time and with the appropriate degree of accuracy. The big chunks of BI project costs are located in the four pillars that I consistently refer to:

  1. Understand the important business decisions and what figures are necessary to support these.
  2. Understand the data available in the organisation, how it relates to other data and to business decisions.
  3. Transform the data to provide information answering business questions.
  4. Focus on embedding the use of information in the corporate DNA.

The cost of the BI tools themselves are only a minor part of the above (see also, BI implementations are like icebergs). Of course any savings made on tools may make funds available for other parts of the project. It is however important not to cut your nose off to spite your face here. Picking right tools for the job, be they from one vendor or two (or even three at a push) will be much more important to the overall payback of your project than saving a few nickels and dimes by sticking to a one-vendor strategy just for the sake of it.


Continue reading about this area in: Using multiple business intelligence tools in an implementation – Part II