The importance of feasibility studies in business intelligence

Introduction

Feasibility Study

In a previous article, A more appropriate metaphor for business intelligence projects, I explained one complication of business intelligence projects. This is that the frequently applied IT metaphor of building is not very applicable to BI. Instead I suggested that BI projects had more in common with archaeological digs. I’m not going to revisit the reasons for the suitability of looking at BI this way here, take a look at the earlier piece if you need convincing, instead I’ll focus on what this means for project estimation.

When you are building up, estimation is easier because each new tier is dependent mostly on completion of the one below, something that the construction team has control over (note: for the sake of simplicity I’m going to ignore the general need to dig foundations for buildings). In this scenario, the initial design will take into account of facts such as the first tier needing to support all of the rest of the floors and that central shafts will be needed to provide access and deliver essential services such as water, electricity and of course network cables. A reductionist approach can be taken, with work broken into discrete tasks, each of which can be estimated with a certain degree of accuracy. The sum of each of these, plus some contingency, hopefully gives you a good feel for the overall project. It is however perhaps salutary to note that even when building up (both in construction and in IT) estimation can still sometimes go spectacularly awry.

When you are digging down, your speed is dependent on what you find. Your progress is dictated by things that are essentially hidden before work starts. If your path ahead (or downwards) is obscured until your have cleared enough earth to uncover the next layer, then each section may hold unexpected surprises and lead to unanticipated delays. While it may be possible to say things like, “well we need to dig down 20m and each metre should take us 10 days”, any given metre might actually take 20 days, or more. There are two issues here; first it is difficult to reduce the overall work into tasks, second it is harder to estimate each task accurately. The further below ground a phase of the dig is, the harder it will be to predict what will happen before ground is broken. Even with exploratory digs, or the use of scanning equipment, this can be very difficult to assess in advance. However it is to the concept of exploratory digs that this article is devoted.
 
 
Why a feasibility study is invaluable

At any point in the economic cycle, even more so in today’s circumstances, it is not ideal to tell your executive team that you have no idea how long a project will take, nor how much it might cost. Even with the most attractive of benefits to be potentially seized (and it is my firm belief that BI projects have a greater payback than many other types of IT projects), unless there is some overriding reason that work must commence, then your project is unlikely to gain a lot of support if it is thus characterised. So how to square the circle of providing estimates for BI projects that are accurate enough to present to project sponsors and will not subsequently leave you embarrassed by massive overruns?

It is in addressing this issue that BI feasibility studies have their greatest value. These can be thought of as analogous to the exploratory digs referred to above. Of course there are some questions to be answered here. By definition, a feasibility study cannot cover all of the ground that the real project needs to cover, choices will need to be made. For example, if there are likely to be 10 different data sources for your eventual warehouse, then should you pick one and look at it in some depth, or should you fleetingly examine all 10 areas? Extending our archaeological metaphor, should your exploratory dig be shallow and wide, or a deep and narrow borehole?
 
 
A centre-centric approach

In answering this question, it is probably worth considering the fact that not all data sources are alike. There is probably a hierarchy to them, both in terms of importance and in terms of architecture. No two organisations will be the same, but the following diagram may capture some of what I mean here:

Two ways of looking at a systems' hierarchy

The figure shows a couple of ways of looking at your data sources / systems. The one of the left is rather ERP-centric, the one on the right gives greater prominence to front-end systems supporting different lines of business, but wrapped by a common CRM system. There are many different diagrams that could be drawn in many different ways of course. My reason for using concentric circles is to stress that there is often a sense in which information flows from the outside systems (ones primarily focussed on customer interactions and capturing business transactions) to internal systems (focussed on either external or internal reporting, monitoring the effectiveness of processes, or delivering controls).

There may be several layers through which information percolates to the centre; indeed the bands of systems and databases might be as numerous as rings in an onion. The point is that there generally is such a logical centre. Data is often lost on its journey to this centre by either aggregation, or by elements simply not being transferred (e.g. the name of a salesperson is not often recorded on revenue entries in a General Ledger). Nevertheless the innermost segment of the onion is often the most complex, with sometimes arcane rules governing how data is consolidated and transformed on its way to its final destination.

The centre in both of the above diagrams is financial and this is not atypical if what we are considering is an all-pervasive BI system aimed at measuring most, if not all, elements of an organisation’s activity (the most valuable type of BI system in my opinion). Even if your BI project is not all-pervasive (or at least the first phase is more specific), then the argument that there is a centre will probably still hold, however the centre may not be financial in this case.

My suggestion is that this central source of data (of course there may be more than one) is what should be the greatest focus of your feasibility study. There are several reasons for this, some technical, some project marketing-related:

  1. As mentioned above, the centre is often the toughest nut to crack. If you can gain at least some appreciation of how it works and how it may be related to other, more peripheral systems, then this is a big advance for the project. Many of the archaeological uncertainties referred to above will be located in the central data store. Other data sources are likely to be simpler and thus you can be more confident about approaching these and estimating the work required.
  2. A partial understanding of the centre is often going to be totally insufficient. This is because your central analyses will often have to reconcile precisely to other reports, such as those generated by your ERP system. As managers are often measured by these financial scorecards, if you BI system does not give the same total, it will have no credibility and will not be used by these people.
  3. Because of its very nature, an understanding of the centre will require at least passing acquaintance with the other systems that feed data to it. While you will not want to spend as much time on analysing these other systems during the feasibility study, working out some elements of how they interact will be helpful for the main project.
  4. One output from your feasibility study should be a prototype. While this will not be very close to the finished article and may contain data that is both unreconciled and partial (e.g. for just one country or line of business), it should give project sponsors some idea of what they can expect from the eventual system. If this prototype deals with data from the centre then it is likely to be of pertinence to a wide range of managers.
  5. Strongly related to the last point, and in particular if the centre consists of financial data, then providing tools to analyse this is likely to be something that you will want to do early on in the main project. This is both because this is likely to offer a lot of business value and because, if done well, this will be a great advert for the rest of your project. If this is a key project deliverable, then learning as much as possible about the centre during the feasibility study is very important.
  6. Finally what you are looking to build with your BI system is an information architecture. If you are doing this, then it makes sense to start in the middle and work your way outwards. This will offer a framework off of which other elements of your BI system can be hung. The danger with starting on the outside and working inwards is that you can end up with the situation illustrated below.

A possible result of building from the outside in to the center
A possible result of building from the outside in to the centre

 
Recommendations

So my recommendation is that your feasibility study is mostly a narrow, deep dig, focussed on the central data source. If time allows it would be beneficial to supplement this with a more cursory examination of some of the data sources that feed the centre, particularly as this may be necessary to better understand the centre and because it will help you to get a better idea about your overall information architecture. You do not need to figure out every single thing about the central data source, but whatever you can find out will improve the accuracy of your estimate and save you time later. If you include other data sources in a deep / wide hybrid, then these can initially be studied in much less detail as they are often simpler and the assumption is that they will support later deliveries.

The idea of a prototype was mentioned above. This is something that is very important to produce in a feasibility study. Even if we take to one side the undeniable PR value of a prototype, producing one will allow you to go through the entire build process. Even if you do this with hand-crafted transformation of data (rather than ETL) and only a simplistic and incomplete approach to the measures and dimensions you support, you will at least have gone through each of the technical stages required in the eventual live system. This will help to shake out any issues, highlight areas that will require further attention and assist in sizing databases. A prototype can also be used to begin to investigate system and network performance, things that will influence your system topology and thereby project costs. A better appreciation of all of these areas will help you greatly when it comes to making good estimates.

Having understood quite a lot about your most complex data source and a little about other ones and produced a prototype both as a sales tool and to get experience of the whole build process, you should have all the main ingredients for making a credible presentation to your project sponsors. In this it is very important to stress the uncertainties inherent in BI and manage expectations around these. However you should also be very confident in stating that you have done all that can be done to mitigate the impact of these. This approach, of course supported by a compelling business case, will position you very well to pitch your overall BI project.

 

The Register’s take on Microsoft and Oracle / Sun

The Register

Today I read an article on The Register by Gavin Clarke. This was about Microsoft’s potential response to Oracle’s proposed acquisition of Sun Microsystems and was entitled (rather cryptically in my opinion) Microsoft’s DNA won’t permit Oracle-Sun deal – Ballmer knows his knitting.

Gavin quotes Steve Ballmer, Microsoft CEO, as saying that his corporation will be “sticking to the knitting” in response to Oracle‘s swoop on Sun. He goes on to cover some aspects of the Oracle / Sun link-up; specifically referring to the idea of “BI in a box” that seems to be gaining credence as one rationale for the deal. In his words, this trend is about:

storing, serving, and understanding information […]: the trend for getting fast access to huge quantities of data on massive networks and making sense of it.

However mention is then made of co-offerings that Oracle and HP have teamed up to make in this space – surely something that would be potentially jeopardised by the Sun acquisition:

Oracle last year announced the HP Oracle Exadata Storage Server and HP Oracle Database Machine, a box from Hewlett-Packard featuring a stack of pre-configured Exadata Storage Servers all running Oracle’s database and its Enterprise Linux.

Returning to Microsoft’s response, the article stresses their modus operandi of focussing on software components and then collaborating with others on hardware. Refernce is also made to Kilimanjaro, Microsoft’s forthcoming SQL Server version that will further emphasise business intelligence capabilities.

In closing Gavin states that:

Acquisition of a hardware company would break the DNA sequence and fundamentally change Microsoft in the way that owning Sun’s hardware business will change Oracle.

It’s tempting to note that DNA is broken (and then recombined) millions of times by RNA Polymerase, that is after all how proteins are synthesised in cells; one characteristic of Microsoft’s success (notwithstanding its recent announcement of its first ever dip in sales) has been a willingness to reinvent parts of its business (else where did the XBox come from), while relying on a steady income stream from others. When it comes to the idea of Microsoft acquiring a major hardware vendor, I agree it seems far-fetched at present, but never say never.


The Register is the one of the world’s biggest online tech publications and is headquartered in London and San Francisco. It has more than five million unique users worldwide. The US and the UK account for more than 1.5 million readers each a month.Most Register readers are IT professionals – software engineers, database administrators, sysadmins, networking managers and so on, all the way up to CIOs. The Register covers the issues they face at work every day – in software, hardware, networking and IT security. The Register is also known for its “off-duty” articles, on science, tech culture, and cult columnists such as BOFH and Verity Stob, which reflect our readers’ many personal interests.
 

Combinatorics

The smallest bridgeless cubic graph with no three-edge colouring

Some of the furore following on from the announcement of the proposed acquisition of Sun Microsystems by Oracle appears to have died down today. However, taking a look round the blogosphere and various on-line discussion forums1, there does not seem to be much of a consensus about Oracle’s motivations, or future plans for Sun. There are a number of moving parts to this:

  1. Sun’s hardware platforms
  2. Solaris
  3. Java
  4. MySQL
  5. OpenOffice.org

One area that people seem agreed upon is the importance of Java to Oracle’s application strategy, so it makes sense – as a defensive move if nothing else – for them to seek to prevent influence over its future direction falling into the hands of a competitor (which in turn raises the question of when exactly Oracle and Sun started talking and how much overlap there was with the IBM negotiations).

The future of MySQL seems less clear. Some commentators feel that Oracle will support it and allow it to continue to thrive as one of their products. At the other extreme, I have seen suggestions that it will be killed off. Of course as an open source database, this might be easier said than done. There seems to have been a steady trickle of MySQL people out of Sun, pre-acquisition and I would have thought that there is enough expertise and ownership outside of Oracle/Sun for MySQL to have some sort of future regardless of Oracle’s strategy for it.

A bit of a dark horse is OpenOffice.org. A lot of commentary has focused on Oracle positioning themselves to compete with IBM via the acquisition. Perhaps OpenOffice.org offers Larry Ellison another chance to cross swords with his old adversaries at Microsoft.

Moving from software to operating systems, Sun’s Solaris has probably suffered more than most from the rise of Linux, but there have been rumours about Solaris offering Oracle a better route to the current technology Nirvana of cloud computing. Whether this is really the case, I’ll leave to more technically competent authorities to discuss.

But beneath Solaris beats the SPARC chips and other components of Sun’s hardware. Is Oracle’s real aim to offer a complete solution: ERP, CRM, BI and DW in a box? Sun’s hardware has not exactly been flying off the shelf in recent months, but perhaps the sales team at Oracle have other ideas. Maybe their feeling is that all that Sun’s boxes need is to be part of a more alluring overall package. Leveraging Sun’s hardware and operating system is what many people assume is behind Oracle’s strategy. This is certainly the path that would lead to challenging IBM as a company that can meet many of an organisation’s needs as a one-stop-shop.

However, this segues into another observation. If Oracle really has IBM in its sights, then it lacks one crucial piece of ammunition, a global services organisation; the sort of outfit that IBM acquired from the hiving off of PwC’s consulting arm. Maybe now is a good time to but stock in CSC?

But to return to some of the points I made earlier, there is a further possibility. Perhaps Oracle don’t want to move into the fiercely competitive and low-margin arena of hardware sales after all. Perhaps it was Sun’s software assets that were the real goal. Does Oracle really want to position itself as a hardware vendor, no doubt poisoning strong relationships with people such as HP in the process? Maybe not. If this is indeed the case then maybe there will be a spin-off of Sun’s hardware assets, or indeed a sale to someone like HP – assuming that they wanted them.

One of the most intriguing aspects of Oracle’s proposed acquisition of Sun is just how many balls have been thrown up into the air by it. It will be really interesting to see how they fall over the next few months.


1. Some of the blogs that I have read on this subject are acknowledged at the end of my earlier article.

A further main source has been comments on various LinkedIn.com groups, notably: CIO Forum (CIO.com and CIO Magazine), CIOs.com: Chief Information Officer Network and The IT Architect Network. As always, membership of LinkedIn.com and the group is required to view these.

Finally, you can sometimes glean a lot from 140 characters, so various comments on Twitter have also been influential.


Mergers and value

and they all lived happily ever after?

Today’s big news is of course that Oracle and Sun Microsystems “have entered into a definitive agreement under which Oracle will acquire Sun common stock for $9.50 per share in cash.”

As Sun’s press release goes on to say, “the transaction is valued at approximately $7.4 billion”. At the time of writing, Sun’s stock was up nearly 36% and Oracle‘s was down just over 1%. The price Oracle is paying represents a 42% premium over Sun’s closing stock price on Friday – that’s a big premium.

What is interesting is that the previous mooted IBM / Sun deal appears to have foundered at least partly on issues of price (though potential antitrust issues were also a concern). IBM was rumoured to have offered a price identical to what Oracle will now be paying. So what, taking Larry Ellison’s deep pockets to one side, was the difference?

Well while there seemed to be some synergies for IBM in the earlier deal (a big say in the future of Java obviously being one that would have attracted both suitors), the acquisition of Sun is unarguably a much more transformational event for Oracle. Despite Sun’s recent problems in shifting big iron (funny how UNIX platforms are now viewed that way isn’t it?), Oracle post-acquisition will have a product set ,matched by few companies. In fact it will probably be matched by only one: IBM. So, while buying Sun might have made business sense for IBM, it would not have changed the nature of the organisation overnight. Oracle’s announcement today would appear to have done just that, positioning them as the other big beast in the “buy everything from us” jungle. Whether this deal proves successful for all concerned (and not just Sun’s shareholders) is a question whose answer will probably not be clear for a long time.

A comparisson of Oracle and Sun's positions with key competitors in the Forbes Global 2000

Stepping back from all this IT fervour for a moment, it is perhaps instructive to compare the merger madness that seems to have taken over the sector with trends outside the technology industry. Here the picture is very different. Over the last 10 years the majority of sprawling conglomerates have been split up; previously cherished businesses have been spun off, or sold to competitors. This has all been in homage to the business school orthodoxy of focus and core competencies. Many an internationally renowned name now sells just a fifth of its previous product set, with other assets now owned by those who can presumably generate greater profit from them and who feel that they are more compatible with their own core strategy. Deals where two similar companies have swapped assets and businesses to create two more distinctive entities have been common. While it is always notoriously difficult to assess the impact of such trends, general opinion seems to be that this phenomenon has generated greater value (or at least destroyed less value) than the previous focus on mergers and acquisitions.

So where does this leave IT with its rash of mega mergers over the last couple of years? Well it could of course be argued that IT itself is a single sector (and thus an area of focus and core competency) and that mergers within the technology sector are not the same as say a consumer electronics firm taking over a Hollywood studio (Sony / Colombia TriStar) or old media taking over new (TimeWarner / AOL). But many elements of Sun and Oracle’s businesses are quite different from each other. Ellison must believe that he can run a more diverse stable and still breed winners. The track record of Oracle successfully managing acquisitions is mostly impressive, so he may have a point. Perhaps bucking the trend towards being highly focussed is a masterstroke. The merger may prove to be a Waterloo for the world’s third biggest software and services firm; but whether they are playing the role of Wellingtion or Napoleon remains to be seen.


Continue reading about this area in: Combinatorics.
 
Much of the following was originally conatained in a comment, but I then thought that it was more appropriate to add this to the main article.

Some thoughts on this area from bloggers that I follow:

I will add more as I come across them.

Also here is an interesting graphic from MySQL.com, which (if you believe it) shows the impact of the Sun acquistion on Oracle’s market share:

UPDATE: The above chart reflects: “According to the recent JoinVision study ‘Open Source in the Fast Lane’, IT specialists indicated they deploy MySQL 30% more frequently than Oracle, SQL Server or DB2.” Not quite the same thing as market share.
 

Trends in Business Intelligence

trends

This year, as in every year since the phrase “Business Intelligence” first came to prominence, there have been a rash of predictions about what will happen with the area in 2009. I have linked to and commented on some of these myself on this blog. This article is my take on the area. I should however explain that there is a twist. These are not the trends that I expect to see in 2009, just my thoughts on what ought to be trends in BI over the next few years. I cannot claim to have any prescience about whether they will come to pass, but I will be encouraged if they do.
 

  1. A more holistic approach to BI in organisations that have already invested
  2. Operational BI
  3. Consolidation of the number of BI platforms with organisations
  4. An increase in the prevalence of BI competency centres
  5. BI teams being jointly owned and managed by business divisions and IT
  6. Data from central warehouses being served to front-end applications
  7. BI data being used to automate some business decisions
  8. Further emphasis on predictive analytics
  9. BI having an increasing role in compliance and risk management
  10. Incorporation of external data into BI platforms
  11. Provision of BI to business partners and/or customers
  12. The most creative users of BI employing it to thrive, even in the current climate

 
1. A more holistic approach to BI in organisations that have already invested

Often BI solutions have started in a single area. Typically – given its direct link to better managing overall performance – this has been around analysing an organisation’s financial results, though implementations starting in the sales and even operational arenas are also not uncommon. BI systems tend to add more value as they bring in more information, particularly where a high-level phenomenon – e.g. a decrease in expenditure – can be attributed to lower level ones – e.g. greater repeat business (business acquisition being more expensive than repeat business in most industries), plus enhanced productivity, plus reduced staff turnover (resulting in lower recruitment and training costs). To do this, BI needs to widen its scope to take on new data sources and combine them in creative ways. Where BI platforms have already added value, there will be pressure from users to expand them to deliver even more utility and provide more sophisticated insights. This in turn will require BI practitioners to take a more holistic view of the area and to develop roadmaps explaining how new data sources will be brought on stream and what business value will result from this.
 
 
2. Operational BI

I think that there is a particular argument for BI to make a greater contribution in the area of operational management, particularly tying this to overall performance. Often BI implementations have focussed on the more stately world of monthly (or weekly) results and steered clear of the daily or hourly demands of operational information. The BI projects that I have seen in the Operational sphere have been more focussed at producing weekly status reports or year-to-date trend analyses. Related to BI platforms expanding to new areas, I see increasing demand for information about the internal effectiveness of an organisation; quickly identifying bottlenecks or areas of inefficiency and tracking efforts to address these. Supporting this type of reporting will often require BI practitioners to rethink their architectures which are often set up to refresh on longer timeframes. This may in turn require the warehouse to support multiple environments with different periodicities.
 
 
3. Consolidation of the number of BI platforms with organisations

It is all too common for organisations to have separate BI implementations. Maybe the ERP system comes with some shrink-wrapped cubes, as does the CRM system. Perhaps Finance have invested in some budget analysis tools and different business units have started dabbling in predictive modelling (see 8. below). Maybe certain power users or numerate departments have their own, much cherished databases. Clearly this approach is sub-optimal. If it was ever acceptable to have such an ad hoc approach to the area, the current economic climate means that there is no longer room for a multitude of platforms, each supported by their own ETL, servers, IT teams and (hopefully) training programmes. While transitional costs may make it impractical for some organisations to move to a single platform in the short term, the reductions in licensing, internal support, data centre and training costs that come from standardising BI tools are compelling. This is to say nothing about reducing the level of confusion in users faced with multiple reporting and analysis systems, each with their own terminology, vagaries of functionality and often un-reconciled to each other. Arguments about certain BI tools being best of breed for particular tasks were never wholly convincing, with the breadth of functionality offered by all of the major players today, any of them will be at least good enough for all but the most exacting of applications.
 
 
4. An increase in the prevalence of BI competency centres

If this is partly as a result of the previous three trends, it also has some drivers all of its own. Even in multinational organisations with highly devolved structures and local accountability, most of the management information that is needed to run businesses will be relatively consistent from country to country and business unit to business unit. Perhaps the sources will vary, but the business transactions that they support are surprisingly consistent. Many organisations are waking up to this fact and pulling BI provision into the centre. There are obvious benefits to this in terms of cost savings, not reinventing the wheel, increasing the consistency of reporting and enabling corporate roll-ups. However, my own feeling is that the best organisations will supplement a strong central resource with a (probably much smaller) virtual component located close to business needs who can better respond to these in a timely manner, but within an overall information architecture. This hybrid approach offers the best of both worlds.
 
 
5. BI teams being jointly owned and managed by business divisions and IT

It is an oft-repeated aphorism that all IT projects are business projects. While clearly true in theory, there are enough counterexamples to suggest that practise is rather different. However, BI projects have often stayed much closer to this maxim than other IT efforts. This is because BI systems serve no purpose unless they are closely entwined with business goals. Natural selection should weed out any non-business-focussed BI projects eventually; even in the sleepiest of organisations. It is likely that this close relationship will deepen. Whilst many aspects of BI are firmly in the IT arena (managing the regular refresh of multiple terabytes of data effectively clearly being one), I see a joint stewardship of the area developing. By this I mean something deeper than business oversight or steering committees. It is also different to business BI liaison managers being appointed – these roles often have the unintended consequence of isolating IT from its customers. What I see emerging in more enlightened organisations is true co-ownership of BI with business and IT management closely collaborating to run the area.
 
 
6. Data from central warehouses being served to front-end applications

Of course it is not uncommon for transaction processing systems to have buttons or links that call up a given report. What I am talking about here is a closer coupling, one that does not require users to leave their current system and where information from the warehouse is presented in a seamless manner to users. While such information will have all the BI benefits of being reconciled, consistent and accurate, its provenance will increasingly become invisible to the user (who shouldn’t really have to worry where figures come from so long as they are accurate). This is an area in which web-services have some real potential to leverage the investments that organisations have made in warehouses.
 
 
7. BI data being used to automate some business decisions

Stepping a little further along the path from the previous point, even before users of front-end systems have a need to review information about a transaction, it may well be that the information itself has been what determines whether a human is involved or not. Already some organisations perform triage on business transactions. Ones that meet all of a number of requirements get processed automatically. Ones that meet some of them, but not all, may get routed to junior staff, whose role is to determine whether they require further review or can proceed. Finally, those with a major variance to requirements may get sent straight to more senior staff. This approach means that a larger volume of business can be handled and that expensive senior resource is only applied where it is necessary. Of course a prerequisite to this type of approach is having reliable information on which to perform the triage.
 
 
8. Further emphasis on predictive analytics

While the best BI implementations encourage users to extrapolate from past figures to estimate future ones, the degree to which the analytical skills of the user plays a part varies from implementation to implementation. Here by analytics I mean the use of larger data sets to identify trends or exceptions, mostly at a portfolio level. Again, having invested in developing data warehouses, it makes sense to utilise the many and sophisticated tools that are available to carry out advanced statistical analysis on these; the aim being to deduce trends that would be beyond even the most skilled of human analysts. A by-product of successful BI implementations is that they often free the more numerate of people in organisations from the burden of repetitive number crunching and allow them to focus on more added-value work such as this.
 
 
9. BI having an increasing role in compliance and risk management

Sometimes BI projects may have had their genesis in these areas. However, even when this is not the case a pleasing result of having consolidated much of the organisation’s data in one place is that this then forms a valuable resource for compliance and risk management. Indeed, taking an external perspective, regulators tend to view the existence of an enterprise data warehouse as a sign that an organisation takes managing its risks seriously. Although business managers and risk managers may have slightly different (though hopefully complementary) perspectives and want to answer different types of questions, the data that they need to do this is not that dissimilar. Producing compliance suites from a well-designed warehouse is probably not one of the more taxing BI problems. Again expansion in this area is a further example of point 1. in action.
 
 
10. Incorporation of external data into BI platforms

I have spoken above about the remit of BI systems expanding internally and becoming more consistent geographically. A further trend in expansion is to meld internal information with that from external providers. The type of external information would range from industry to industry, but might include market data, information about specific companies or individuals (e.g. credit scores, where the use of these is admissible). For example, in insurance, where I have spent the last twelve years of my career, incorporating information from externally produced flood, or windstorm models is often a priority.
 
 
11. Provision of BI to business partners and/or customers

Sometimes one objective of BI implementations is to better understand the relationships with business partners and customers. I have seen this develop to the degree where output from BI systems is mailed to such counterparties. A logical extension of this is to allow such organisations direct access to “their information”. Of course as with any e-commerce initiative, there would have be to strict controls on what is viewed and who can view it, but these are problems that are regularly addressed in other areas of IT and the tools to do this are readily available.
 
 
12. The most creative users of BI employing it to thrive, even in the current climate

There have been many articles (including ones written by me) which have spoken about good BI being a great defence in times of economic stress. I would go beyond this and state that the real BI pioneers will take advantage of these capabilities to capture markets from their less well-informed competitors and to steer a course away from areas of business that may bring other less-foresighted organisations down. I look forward to seeing case studies bearing this out appear over the next few years.
 

“All that glisters is not gold” – some thoughts on dashboards

Fool's gold

Yesterday I was tweeting quotes from Poe and blogging lines attributed to Heraclitus. Today I’m moving on to Shakespeare. Kudos to anyone posting a comment pointing out the second quote that appears later in the text.
 
 
Introduction

Dashboards are all the rage at present. The basic idea is that they provide a way to quickly see what is happening, without getting lost in a sea of numbers. There are lots of different technologies out there that can help with dashboards. These range from parts of the product suites of all the main BI vendors, through boutique products dedicated to the area, all the way to simply using Java to write your own.

A lot of effort needs to go into how a dashboard is presented. The information really does need to leap off the screen, it is important that it looks professional. People are used to seeing well-designed sites on the web and if your corporate dashboard looks like it is only one step removed from Excel charts, you may have a problem. While engaging a design firm to help craft a dashboard might be overkill, it helps to get some graphic design input. I have been lucky enough over the years to have had people on my teams with experience in this area. They have mostly been hobbyists, but they had enough flair and enough of an aesthetic taste to make a difference.

However, echoing my comments on BI tools in general, I think an attractive looking dashboard is really only the icing on the cake. The cake itself has two main other ingredients:

  1. The actual figures that it presents (and how well they have been chosen) and
  2. The Information Architecture that underpins them

I’ll now consider the importance of these two areas.
 
 
Choosing the KPIs

Filtering out the KPIs

The acronym KPI is bandied about with enormous vigour in the BI community. Sometimes what the ‘K’ stands for can get a bit lost in the cacophony. Stepping back from dashboards for a few minutes, I want to focus on the measures that you have in your general business intelligence applications such as analysis cubes. Things like: sales revenue, units sold, growth, head count, profit and so on.

[Note: If you don’t like BI buzzwords, please feel free to read “figures”, or “numbers” where ever you see “measures”. I may attempt to provide my own definitions of some of these terms in the future as the Wikipedia entries aren’t always that illuminating.]

When you have built a Data Mart for a particular subject area and are looking to develop one or more cubes based on this, you may well have a myriad of measures to select from. In some of the earliest prototype cubes that my teams built, we made the mistake of having too many measures. The same observation equally applied to the number of dimensions (things that you want to slice and dice the measures by, e.g. geography, line of business, product, customer etc.). Having too many measures and dimensions led to a cube that was cumbersome, difficult to navigate and where the business purpose was less that crystal clear. These are all cardinal sins, but the last is the worst as I have referred to elsewhere. The clear objective is to cut down on both the figures and the business attributes that you want to look at them by. We set a rule (which we did break a couple of times for specialist applications) of generally having no more than ten measures and ten dimensions in a cube and ideally having less.

Well this all sounds great, the problem – and the reason for this diversion away from dashboards – is which measures do you keep and which do you drop. Here there is no real alternative to lots of discussions with business partners, building multiple prototypes to test out different combinations and, ultimately, accepting that you might make some mis-steps in your first release and need to revisit the area after it has been “shaken down” by real business use. I won’t delve into this particular process any deeper now. Suffice it to say that choosing which measures to include in a cube it is both an area that is important to get right and one in which it is all to easy to make mistakes.

So, retuning to our main discussion, if picking measures at the level of an analysis cube is hard, just how hard is it to pick KPIs for a dashboard. I recall a conversation with the CEO of a large organisation in which he basically told me to just pick the six most important figure and put them on a dashboard (with the clear implication that sooner would be rather better than later). After I had explained that the view of the CEO in this area was of paramount importance and that his input on which figures to use would be very valuable, we began to talk about what should be in and what should be out. After a period of going round in circles, I at least managed to convey the fact that this was not a trivial decision.

What you want with the KPIs on a dashboard is that they are genuinely key and that you can actually tell something from graphing them. The exercise in determining which figures to use and how to present them was a lengthy one, but very worthwhile. You need to rigorously apply the “so what?” test – what action will people take based on the trends and indicators that are presented to them. In the end we went for simplicity, with a focus on growth.

There was a map showing how each country was doing against plan; colour-coded red, amber and green according to their results. There were graphs comparing revenue to budget by month and the cumulative position and there was a break-down by business unit. The only to elements of interaction were to filter for a region or country and a business unit or line of business. Any further analysis required pulling up an underlying cube (actually we integrated the cube with the dashboard so that context was maintained moving from one to the other – this was not so easy as the dashboard and cube tools, while from the same vendor, were on two different major release numbers).

There were many iterations of the dashboard, but the one we eventually went live with received general acclaim. I’m not sure what we could have done differently to shorten the process.
 
 
Where does the data come from?

A dashboard without an underlying Information Architecture

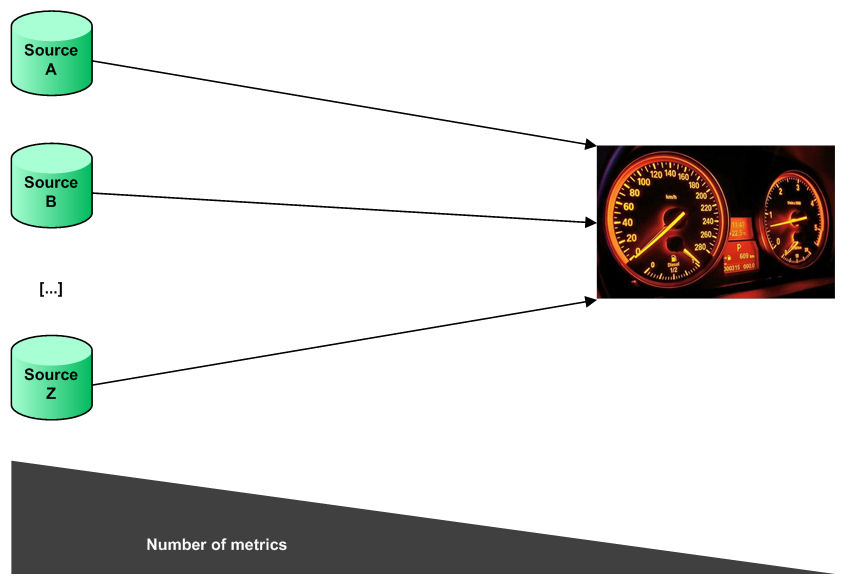
The same range of dashboard tools that I mention in the introduction are of course mostly capable of sourcing their data from pretty much anywhere. If the goal is to build a dashboard, then maybe it is tempting to do this as quickly as possible, based on whatever data sources are to hand (as in the diagram above). This is probably the quickest way to produce a dashboard, but it is unlikely to produce something that is used much, tells people anything useful, or adds any value. Why do I say this?

Well the problem with this approach is that all you are doing is reflecting what is likely to be a somewhat fragmented (and maybe even chaotic) set of information tools. Out of your sources, is there a unique place to go to get a definitive value for measure A? Do the various different sources hold data in the same way and calculate values using the same formulae? Do sources overlap (either duplicating data, or function), if so, which ones do you use? Do different sources get refreshed with the same frequency and do they treat currency the same way? Are customers and products defined consistently everywhere?

A dashboad underpinned by a proper Information Architecture

Leaving issues like these unresolved is a sure way to perpetuate a poor state of information. They are best addressed by establishing a wider information architecture (a simplified diagram of which appears above). I am not going to go into all of the benefits of such an approach, if readers would like more information, then please browse through the rest of this blog and the links to other resources that it contains (maybe this post would be a good place to start). What I will state is that a dashboard will only add value if it is part of an overall consistent approach to information, something that best practice indicates requires an Information Architecture. Anything else is simply going to be a pretty picture, signifying nothing.
 
 
Summary

So my advice to those seeking to build their first dashboard has three parts. First of all, keep it simple and identify a small group of measures and dimensions, which are highly pertinent to the core of the business and susceptible to graphical presentation. Second, dashboards are not a short-cut to management information Nirvana, they only really work when they are the final layer in a proper approach to information that spans all areas of the organisation. Finally, and partly driven by the first two observations, if you are in charge of building a dashboard, make sure that the plans you draw up reflect the complexity of the task and that you manage expectations accordingly.
 

A list of potential DW/BI pitfalls – by someone who has clearly been there

pitfall

Browsing through my WordPress Tag Surfer today (a really nice feature by the way), I came across an interesting list of problems that can occur in a data warehousing / business intelligence project, together with suggestions for managing these. A link appears below:

Eight Reasons why Data Warehouse and, subsequently, Business Intelligence efforts fail

The author, Raphael Klebanov, has clearly lived the data warehousing process and a lot of what he says chimes closely with my own experience.

Some of his themes around business engagement, the alignment of BI delivery with business needs and the importance of education are echoed throughout my own writing. This article is definitely worth a read in my opinion.


Yes I know the illustraion ages me.